
Power Plants and their Impact on Climate Change
The earth's climate has suffered through many changes over time, with events ranging from ice ages to warm, interglacial periods (such as the present era) documented. However, the most rapid warming period observed has occurred in recent decades and scientists from the Intergovernmental Panel on Climate Change (IPCC) [18, 19] have determined that there is a greater than 90 percent chance that most of the current warming is due to the increases in greenhouse gas (GHG) emissions caused by human activities, with the increase in global average temperatures resulting in severe effects on the Earth's climate.

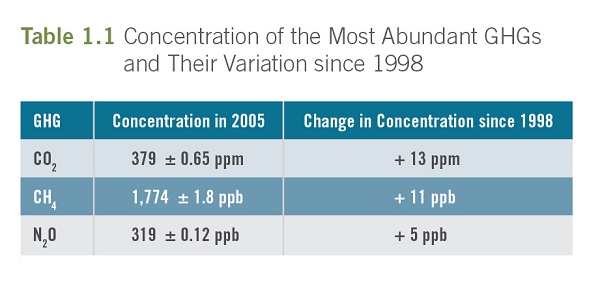
Data reported by the IPCC show that the concentration of atmospheric CO2 has increased from a pre-industrial age value of approximately 280 to 379 ppm in 2005 (see Table 1.1), with emissions from fossil fuel combustion being the main source of this greenhouse gas. The energy sector is central to this, accounting for over 60% [20] of the world's greenhouse gas emissions. As indicated in Section 3.3.5, the energy sector generates emissions of all the principal GHGs and, in particular, carbon dioxide, methane and nitrous oxide, throughout the whole fuel life-cycle, from extraction to combustion. Emissions of GHGs also depend on external factors such as weather conditions, economic growth, and fuel prices, among others.
According to data from the International Energy Agency [8], in 2005 the United States ranked first in CO2 emissions from fuel combustion, while Canada and Mexico were seventh and twelfth, respectively. North America was therefore one of the major contributors of greenhouse gases in the world. Figure 1.3 shows that the contribution of North America to global GHG emissions was 19.4% that year. Canada and Mexico each contributed less than 2% and the United States contributed 16%. GHG emissions from electricity generation using fossil fuels in North America accounted for 6% of the global GHG emissions in 2005. Data in this figure were compiled based on the six major IPCC categories (energy, industrial processes, solvent use, agriculture, land-use change and forestry, and waste); and the global GHG emissions estimate from the World Resources Institute [21].

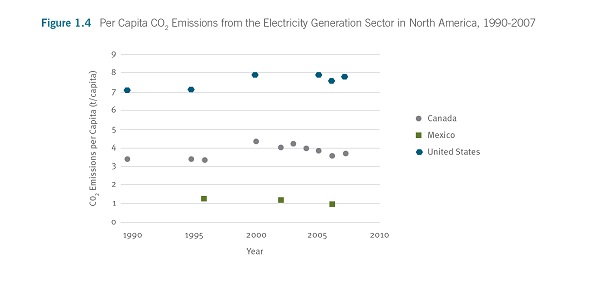
Figure 1.4 shows CO2 emissions per capita for 1990–2007 from fossil fuel-based electricity generation in North America. The emissions data used to create this graph were taken from the GHG emissions inventory reports of each country [22, 23, 24]. A slight decreasing trend is observed after year 2000 in all three countries but the data also suggest that per capita emissions increased from 1990 to 2000. The per capita CO2 emission values estimated on the basis of the 2005 data used for the present report were 3.75, 1.12 and 8.07 t/capita for Canada, Mexico and the United States, respectively; these are in close agreement with the values shown in this figure.
United States
In the 1990–2005 period, emissions of GHGs in the United States increased by about 16%, placing this country at the head of the world's major emitters, with over 16% of global GHG emissions [21, 24]. The increase in GHG emissions since 1990 had been steady (1.5% per year, on average), but as of 2000 GHG emissions started to slow down significantly, increasing only by 2% in the five years from 2000 to 2005 – which can be associated with a reverse in emission trends in the industrial and transportation sectors. GHG emissions per capita in 2005 were 23.8 kt CO2-eq. Of the total GHG emissions in the United States that year, CO2 accounted for 85.6%.
The United States is the largest CO2 emitter in the world, with 21% of the global total of CO2 from fuel combustion in 2005 [8]. The major contribution to total US GHG emissions was from energy-related activities, with 86.7%. The electricity generation sector accounted for 39.1% of the energy sector's GHG emissions; thus, one third of the total GHG emissions in the United States were from electricity generation in 2005. The electricity generation sector contributed 39.3% of the national emissions of CO2 [24]. Emissions of CO2 accounted for 99.4% of the GHG emissions from the electricity generation sector. Per capita emissions of CO2 from the same sector were 8.01 kt CO2-eq, whereas CO2 emissions per GDP were 191 g/US$.1
1 GDP taken at current prices, current PPPs, in 2005 US dollars (US$). OECD. http://stats.oecd.org/Index.aspx. Consulted 18 February 2011.