
Overview of Emissions Data
For the present report, data for a total of 2,834 power plants in the United States were analyzed; however, as explained earlier and, as shown in Table 2.4 below (“total (non-negative)”), only data for 2,728 of those facilities were ultimately used for this report.
Table 2.4 shows a summary of the information gathered for these plants, which appears to be in close agreement with published values. Plant generation capacity is 1% higher than the value quoted in the Electric Power Annual 2005 [35]. On the other hand, the total net electricity generation from fossil fuels exceeds the quoted value by 2%.
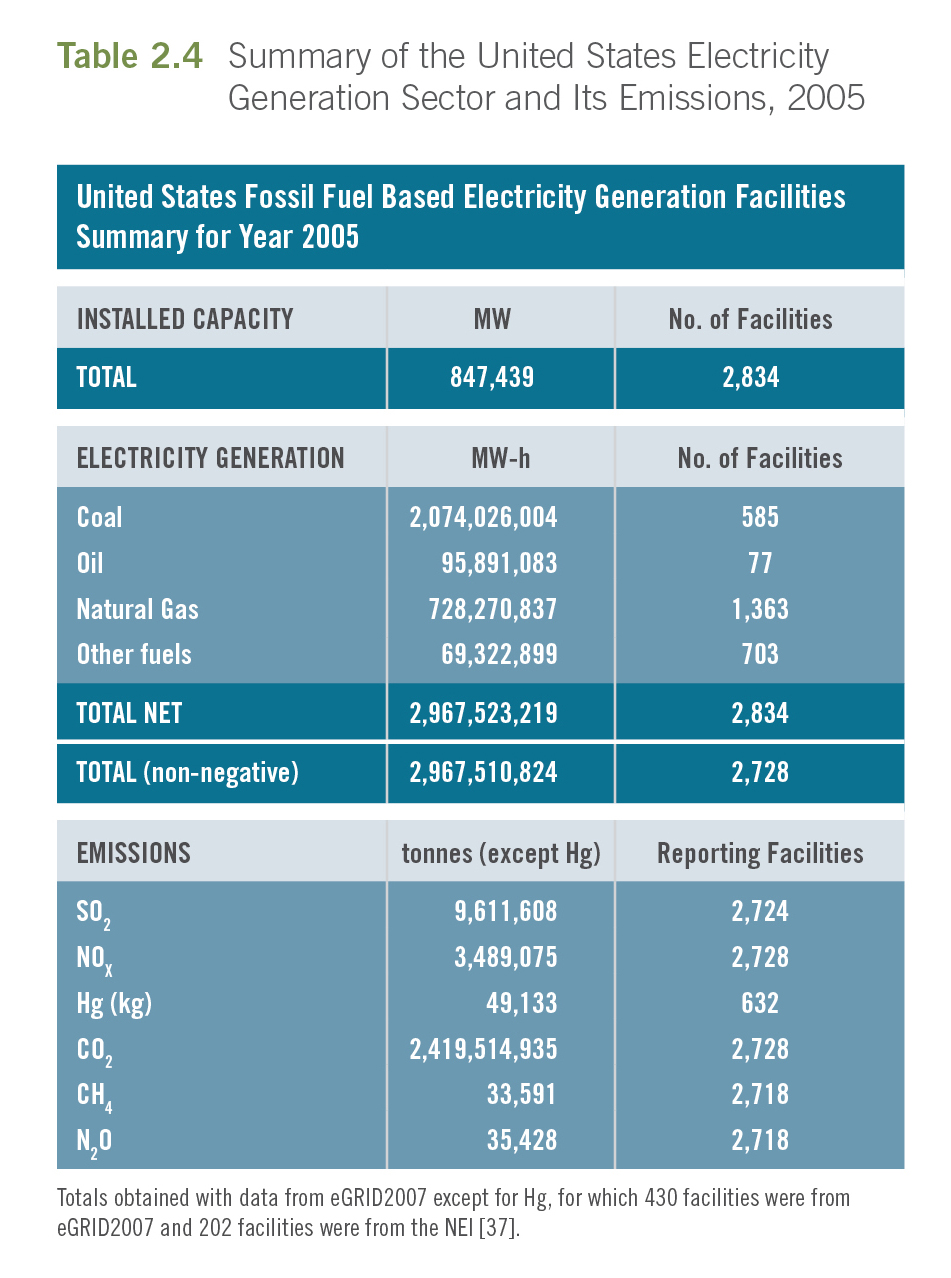
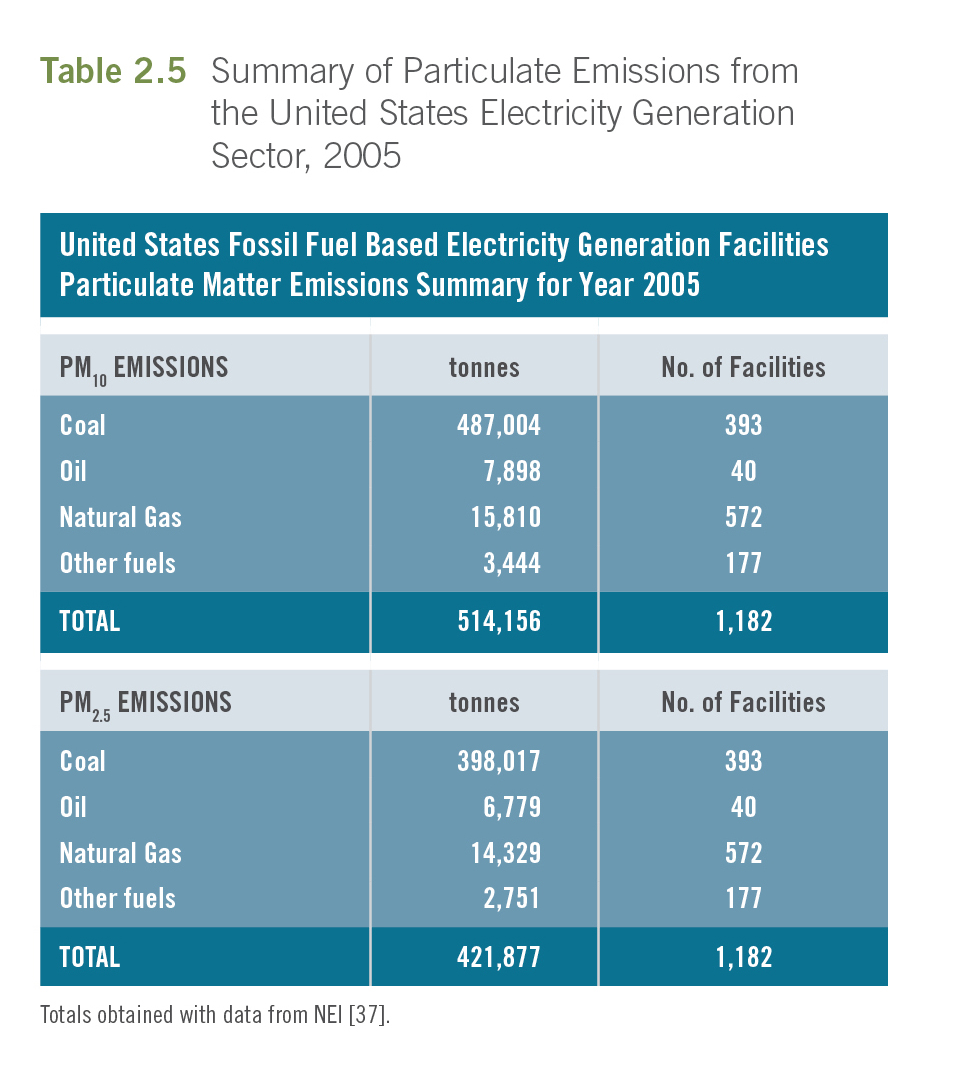
The information in Table 2.4 was mainly obtained from the eGRID2007 database [36], which has no data on emissions of particulate matter. Table 2.5, below, provides a summary of the information relating to emissions of particulate matter taken primarily from the 2005 US National Emissions Inventory [37].
All of the plants considered in Table 2.5 are also included in Table 2.4; however, some of the plants in the eGRID2007 database are not required to report particulate emissions to the NEI. There are differences in relation to generation and fuel utilization between the NEI and the eGRID2007 databases. For consistency, the information from eGRID2007 was given preference over the NEI – except when such information was lacking in the eGRID2007 database. Thus, the available information on particulate matter emissions was not representative of the whole US electricity sector, since it covered only 43% of the number of plants considered in Table 2.4, 71% of the installed capacity and 75% of the total electricity generation.
As can be observed in Table 2.5, coal-fired power stations accounted for approximately 95% of the reported emissions of particulate matter from the electricity generation sector. Additional details are provided in Section 2.3.