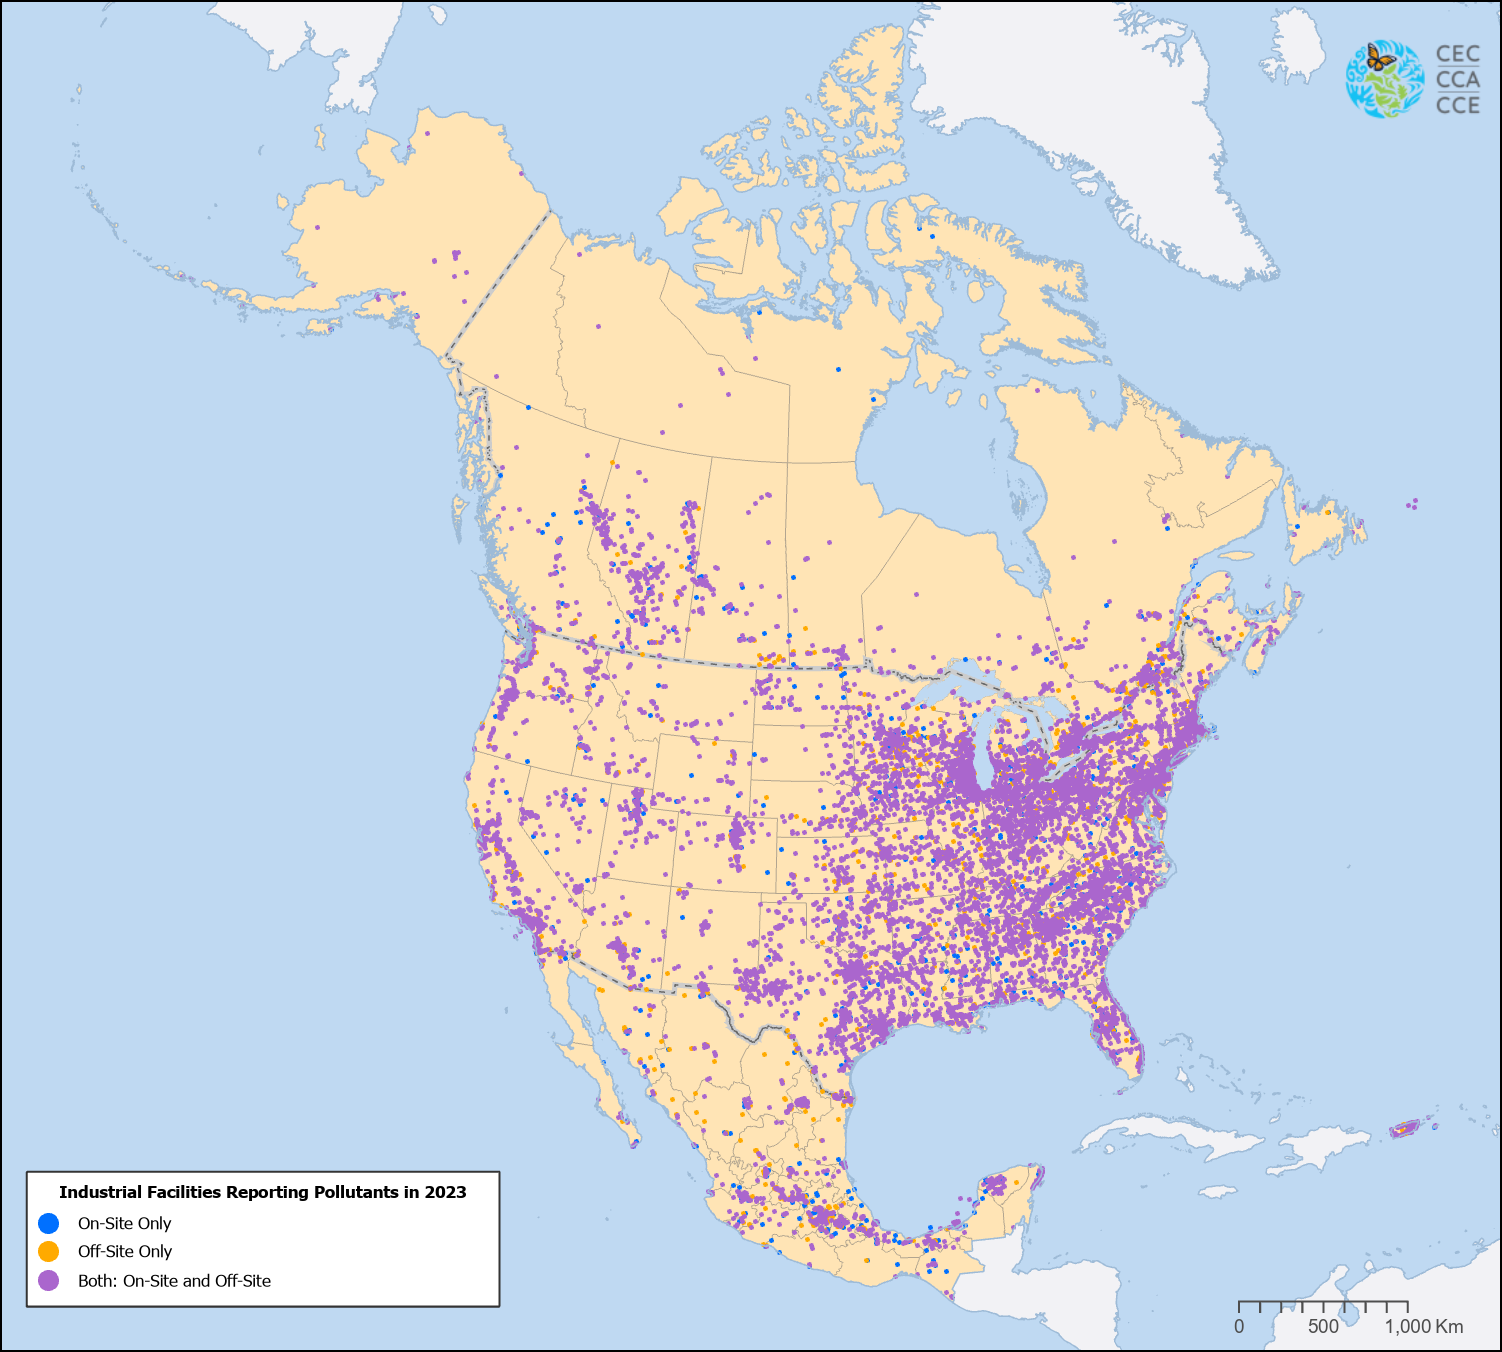
This map shows the locations of about 23,000 industrial facilities in North America that reported...
2026
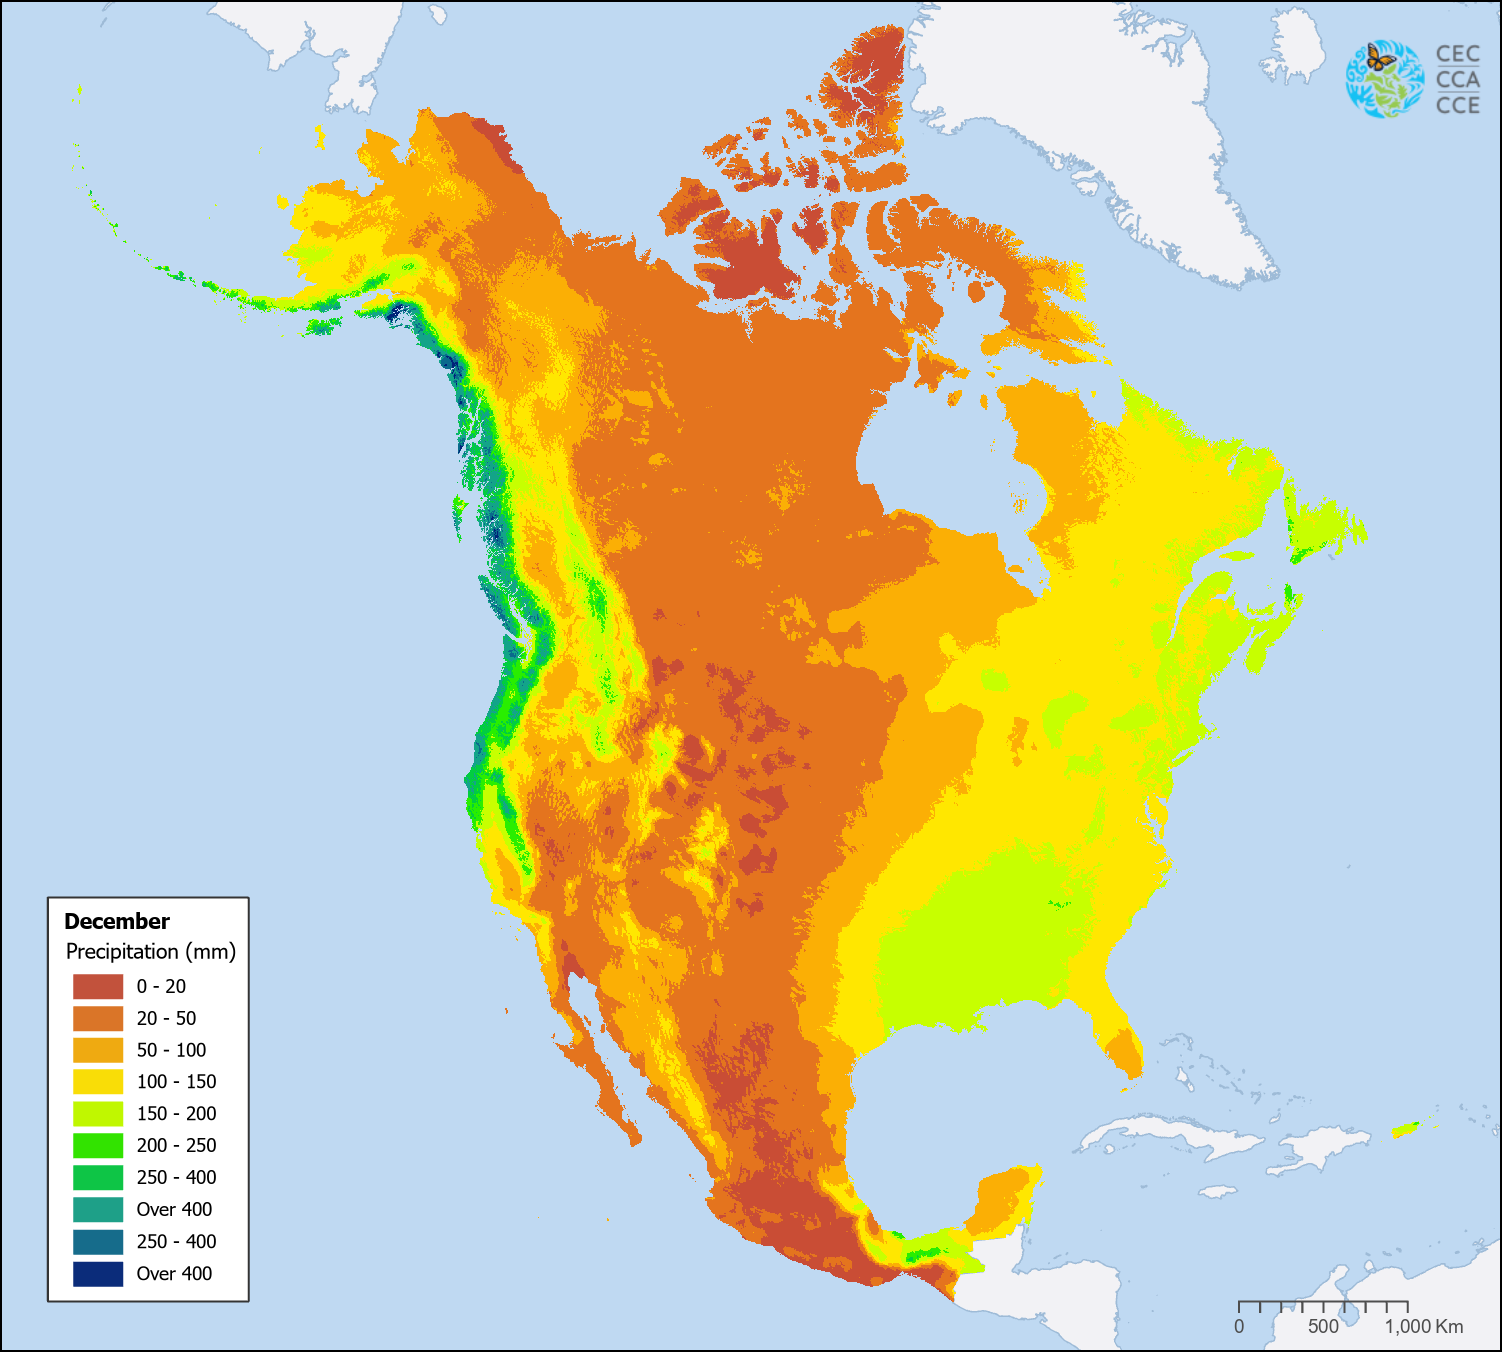
The Monthly Precipitation dataset consists of 12 raster files, one for each month, representing total...
2026
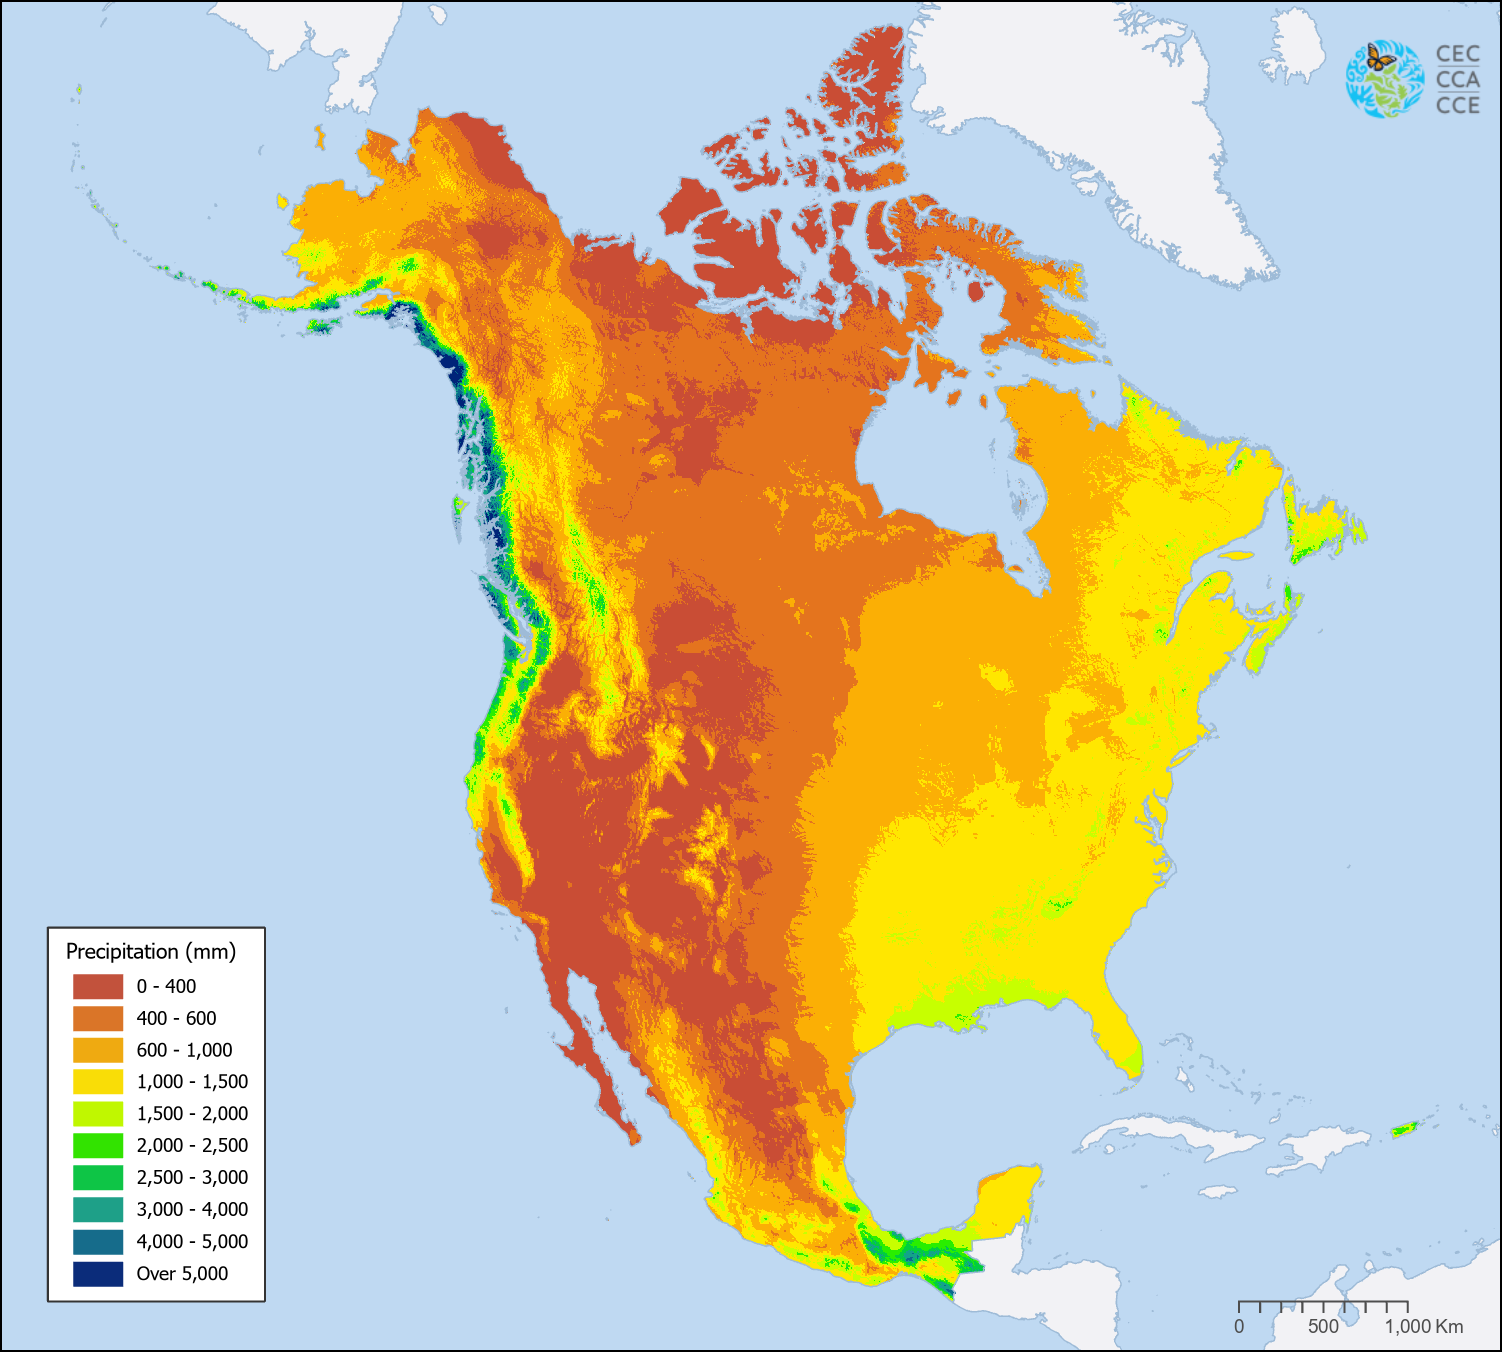
The annual precipitation raster layers available in the North American Environmental Atlas represent key climatological...
2026
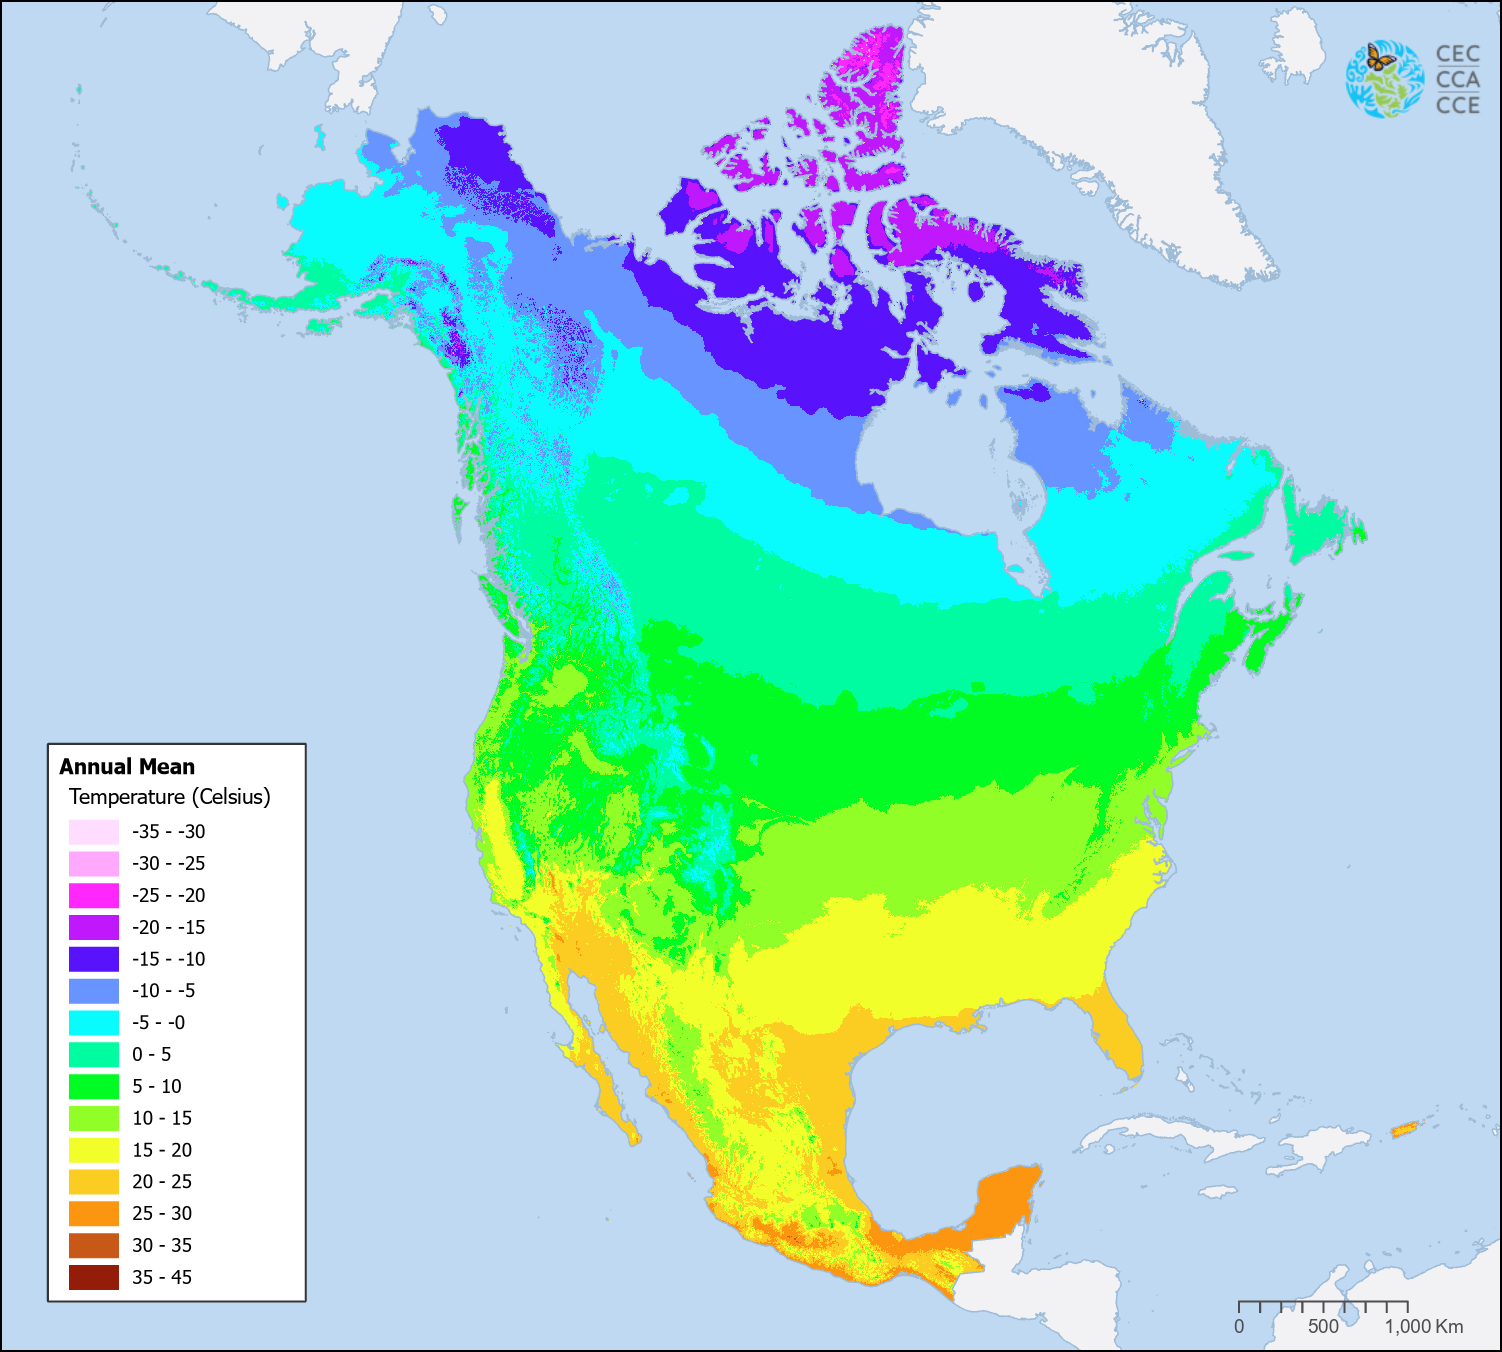
The annual temperature raster layers available in the North American Environmental Atlas represent key climatological...
2026
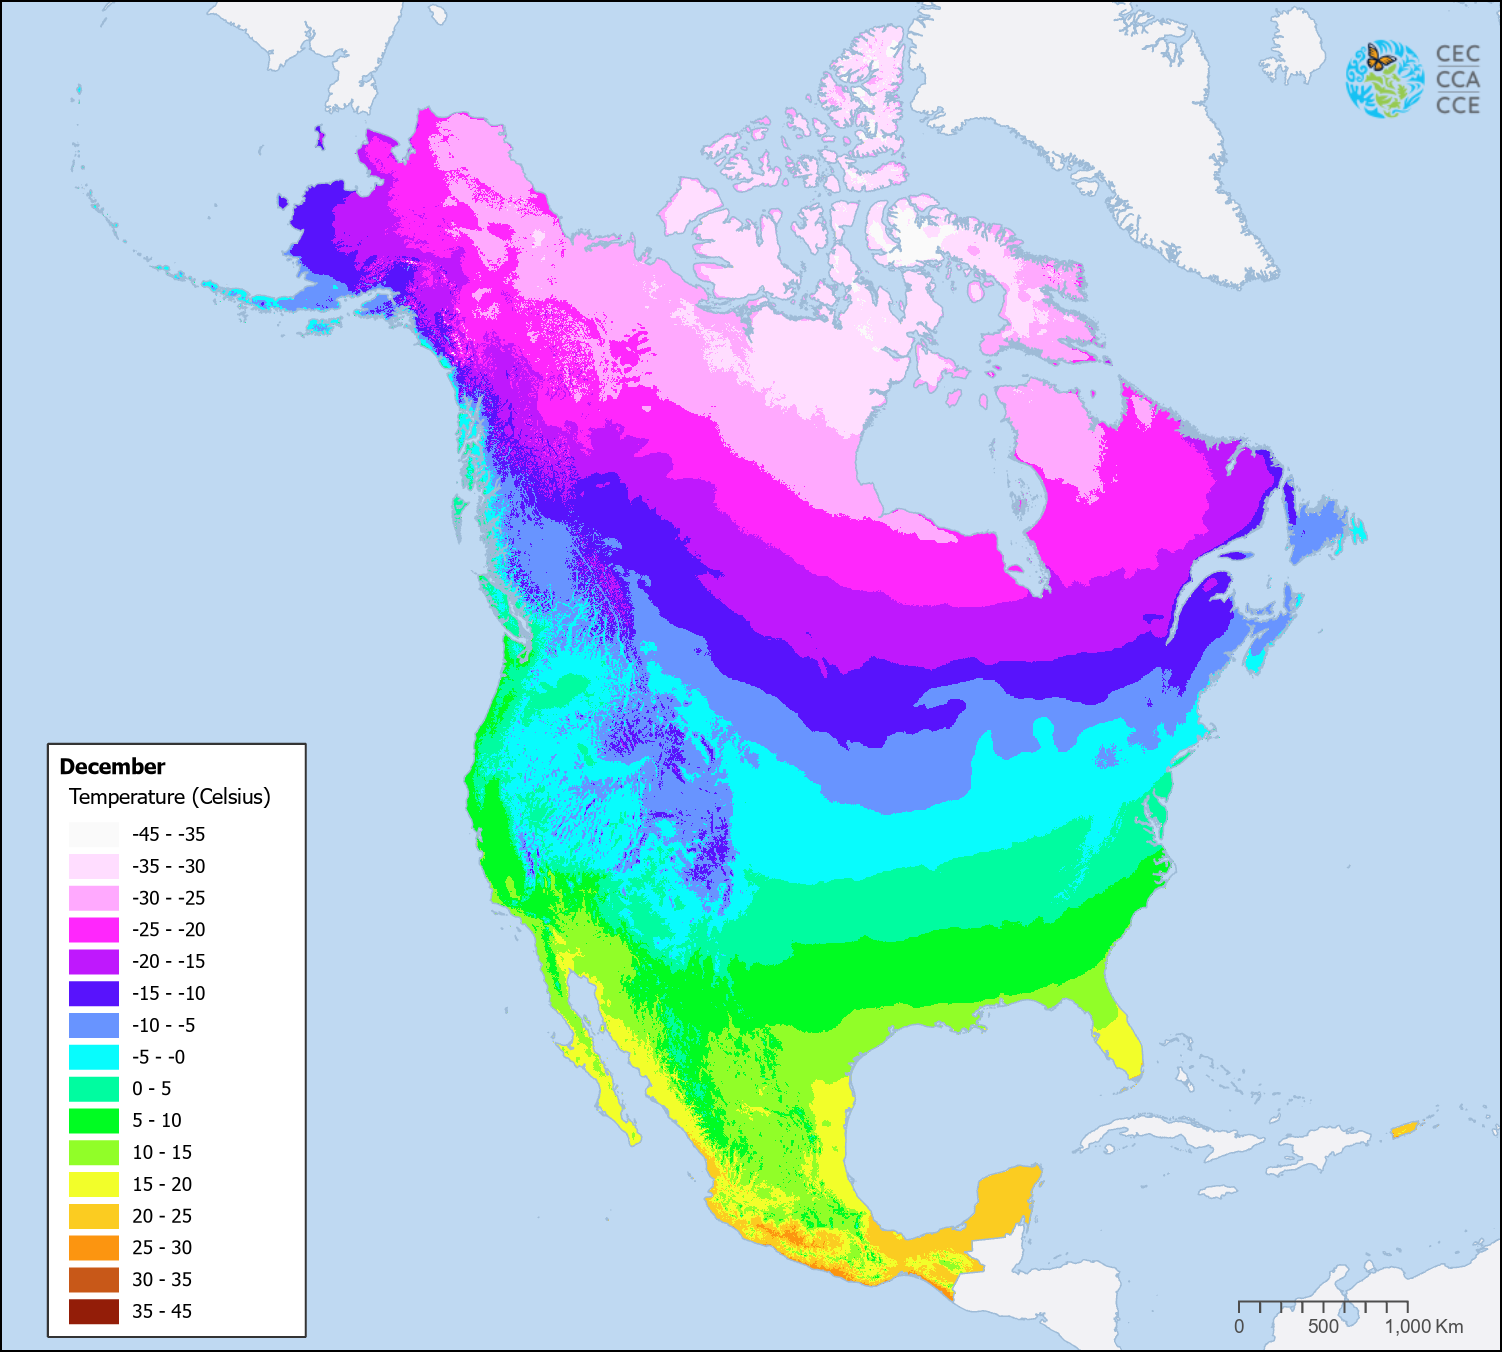
The Monthly Mean Temperature dataset consists of 12 raster files, one for each month, representing...
2026
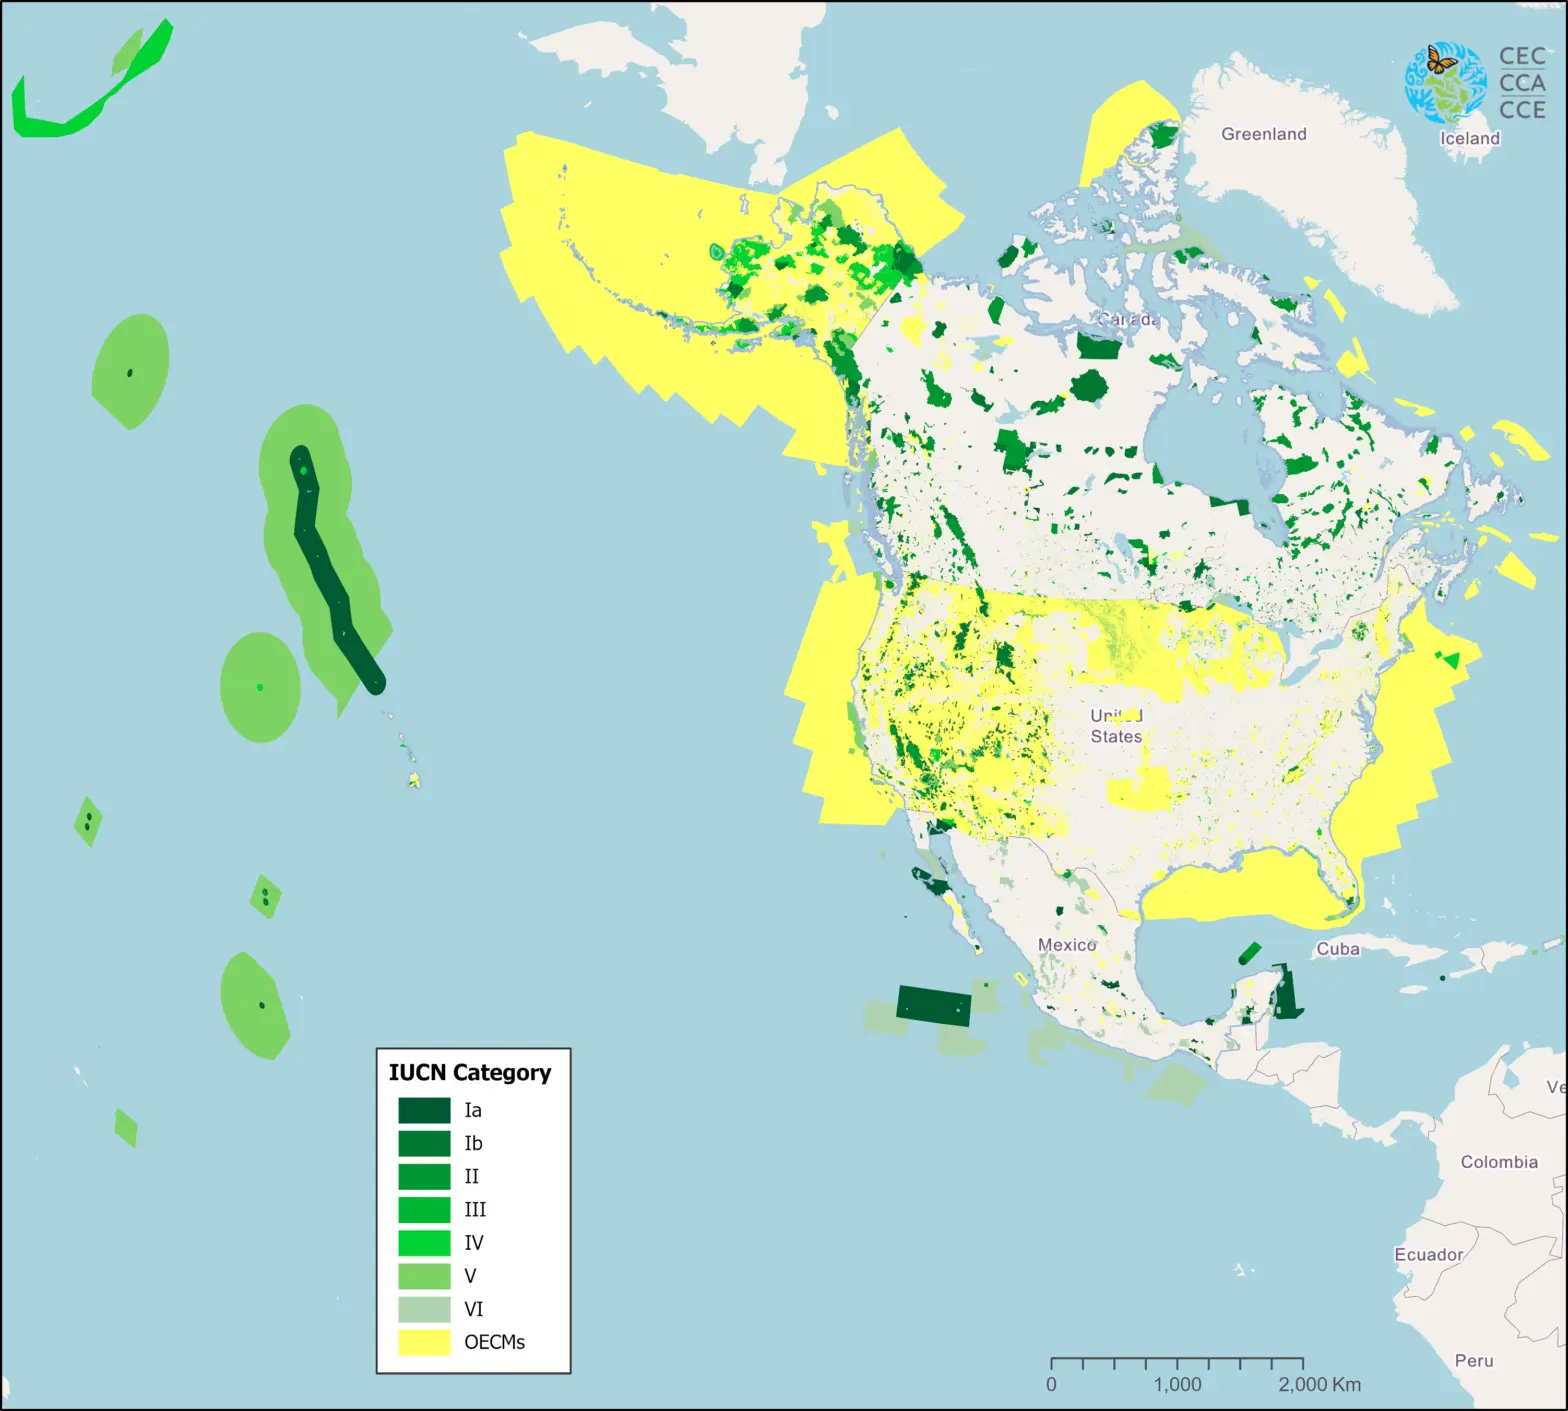
Protected Areas
The new map of North American Protected Areas is an update of the map published...
2025
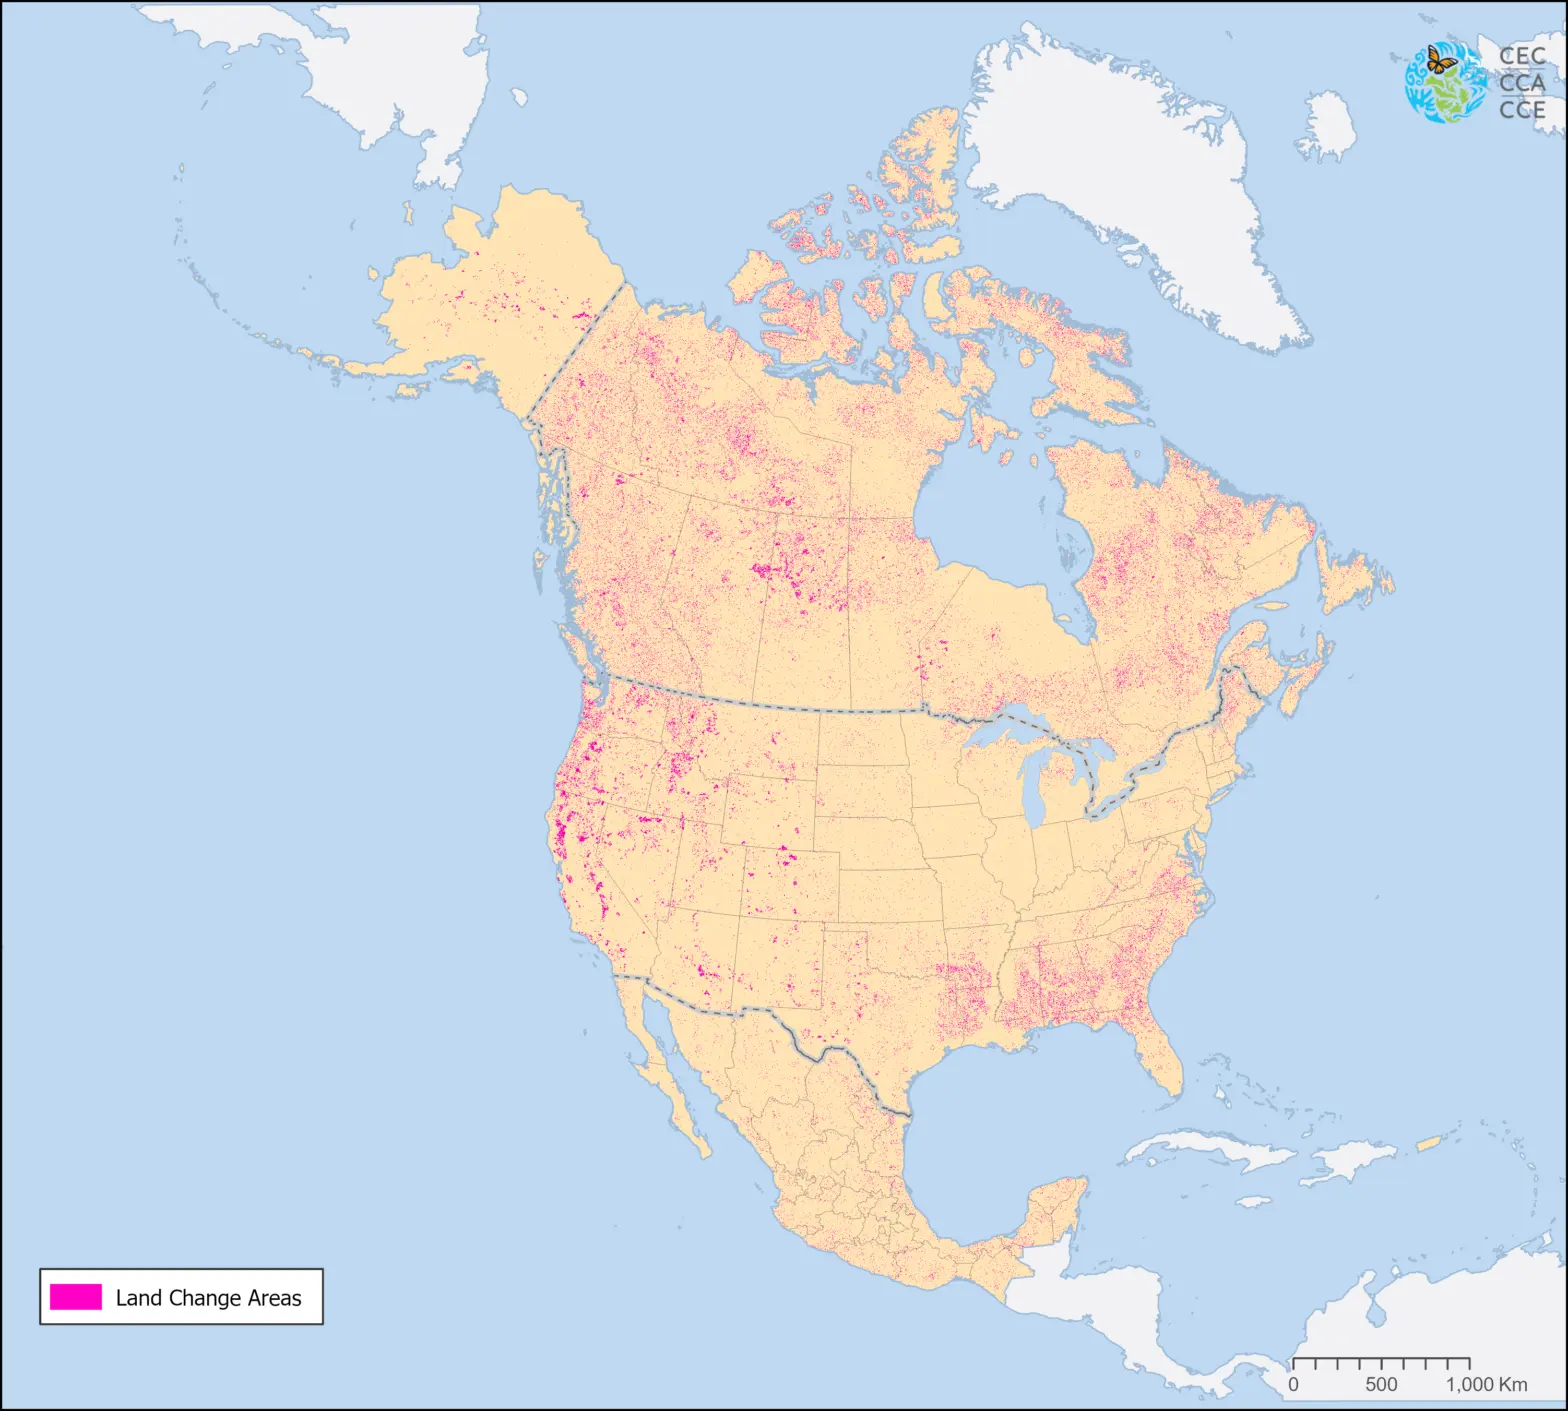
Land Cover
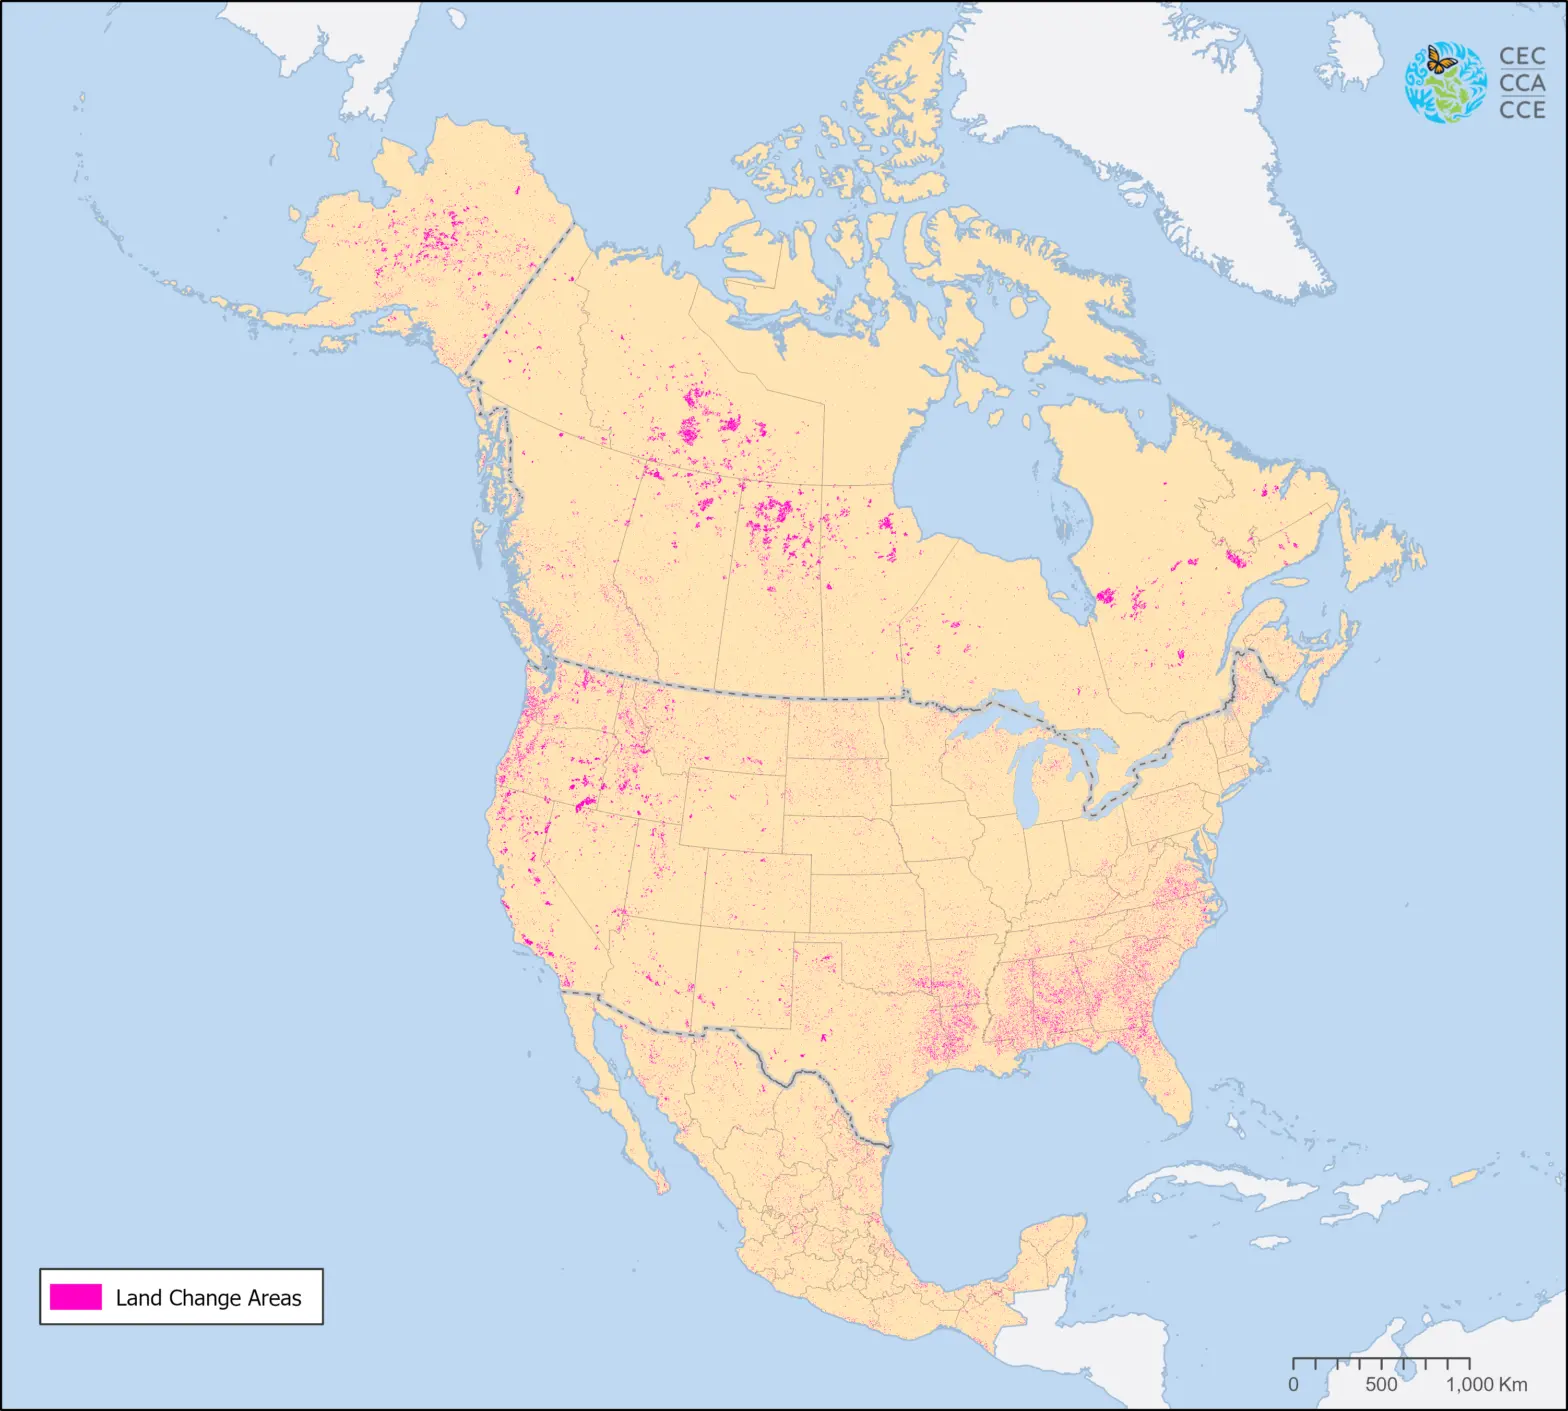
This map demonstrates land cover change between 2015 and 2020 in North America at a...
2024
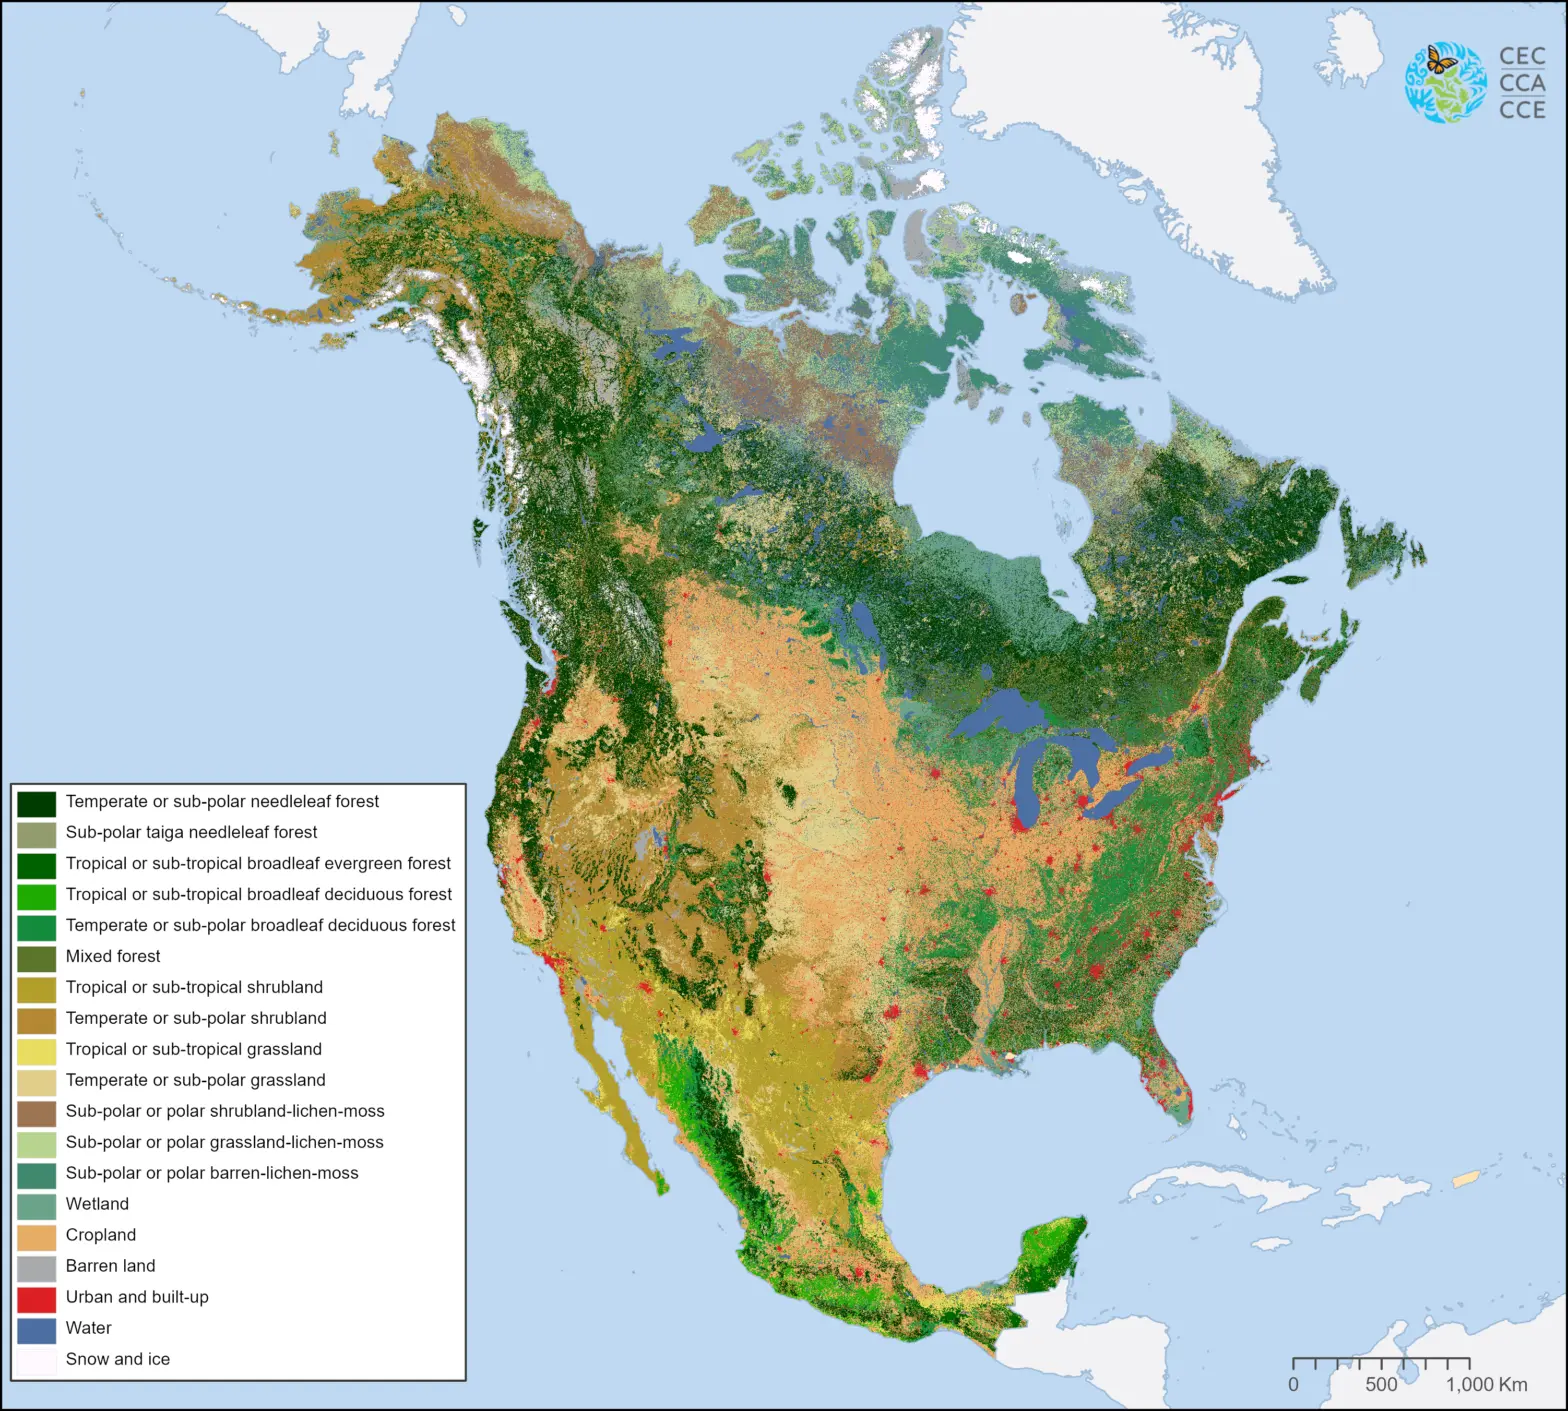
Land Cover
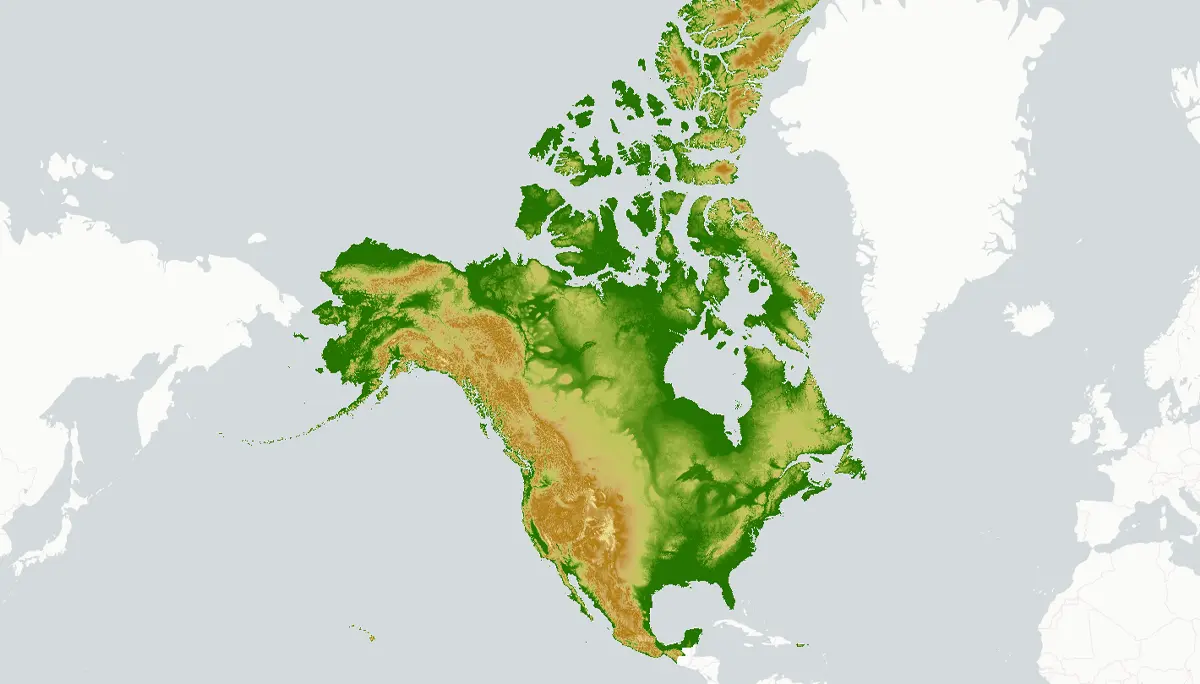
This map of North American land cover provides a harmonized view of the physical cover...
2024
Land Cover
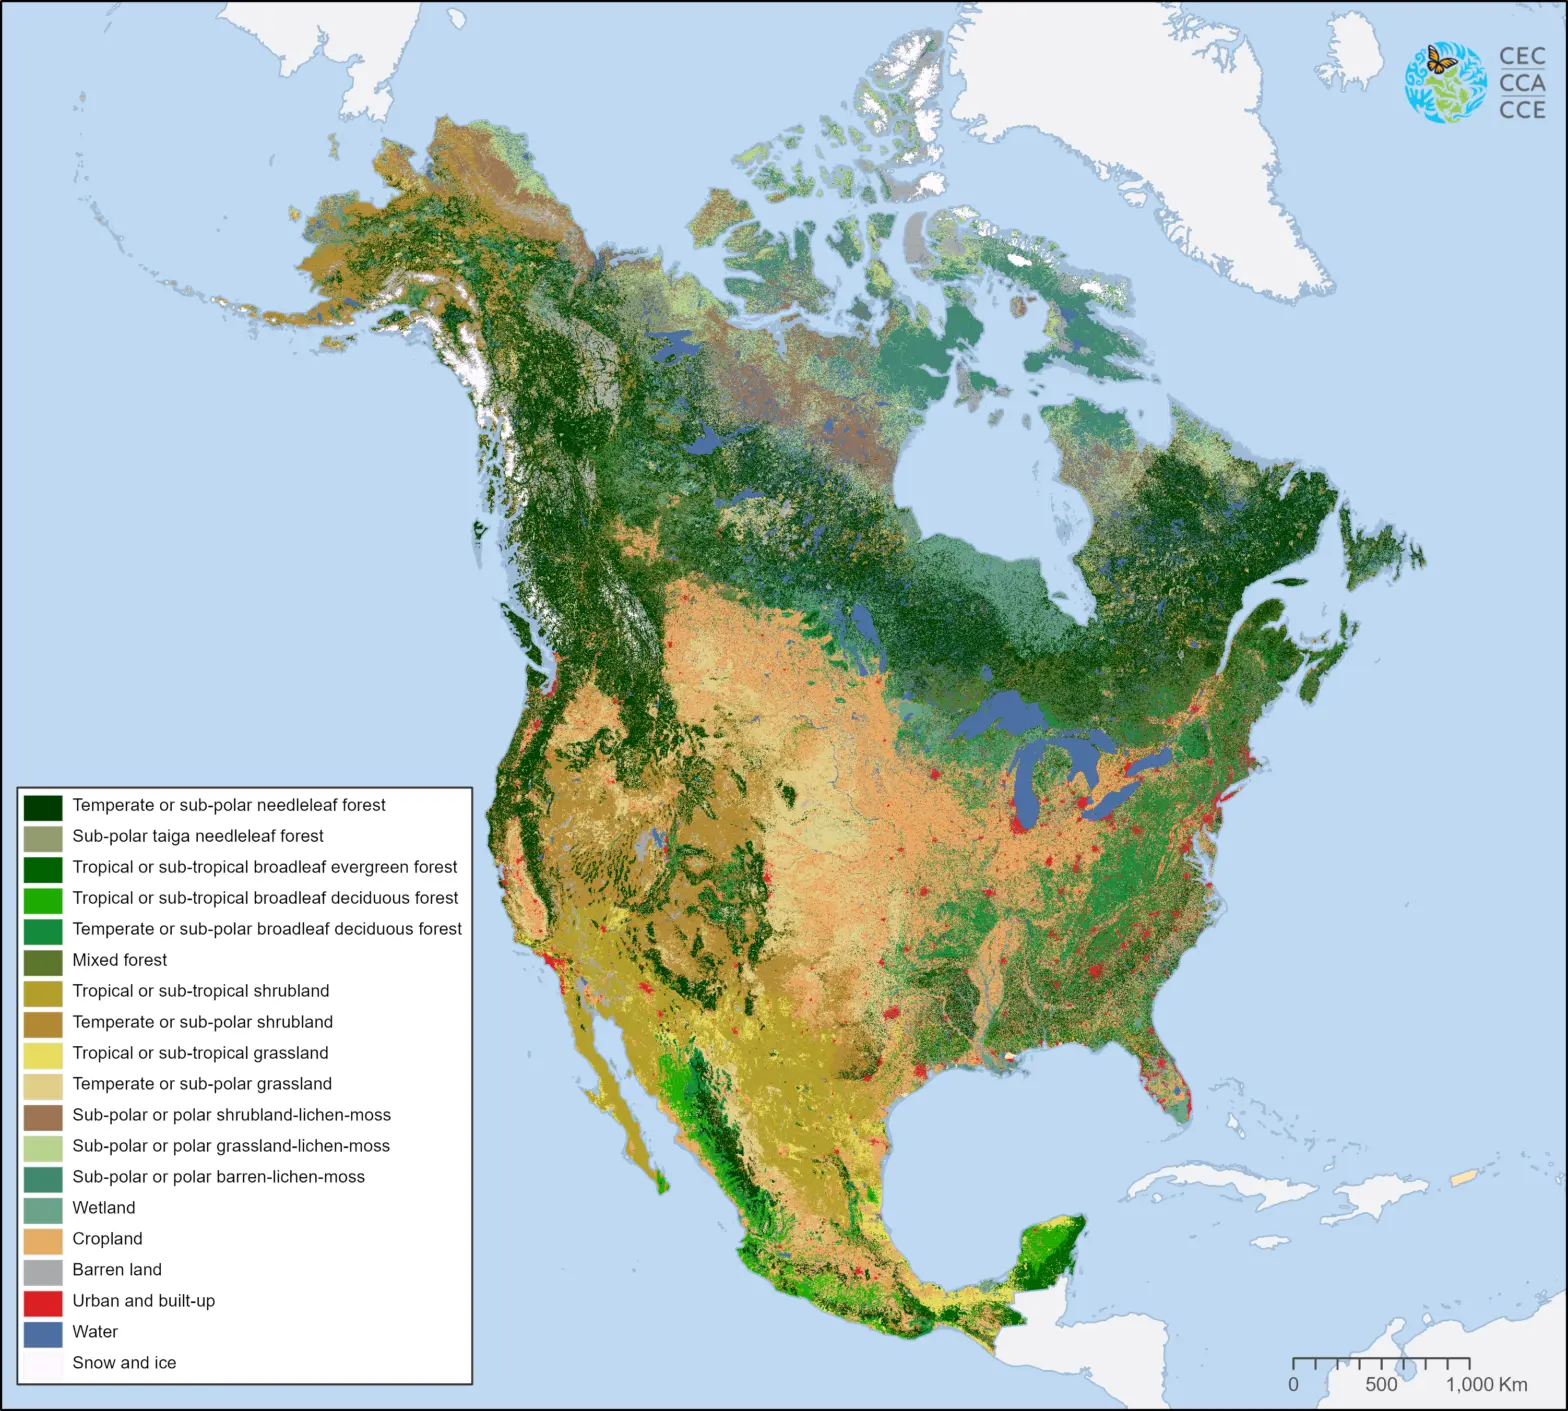
This map demonstrates land cover change between 2010 and 2015 in North America at a...
2024
Land Cover
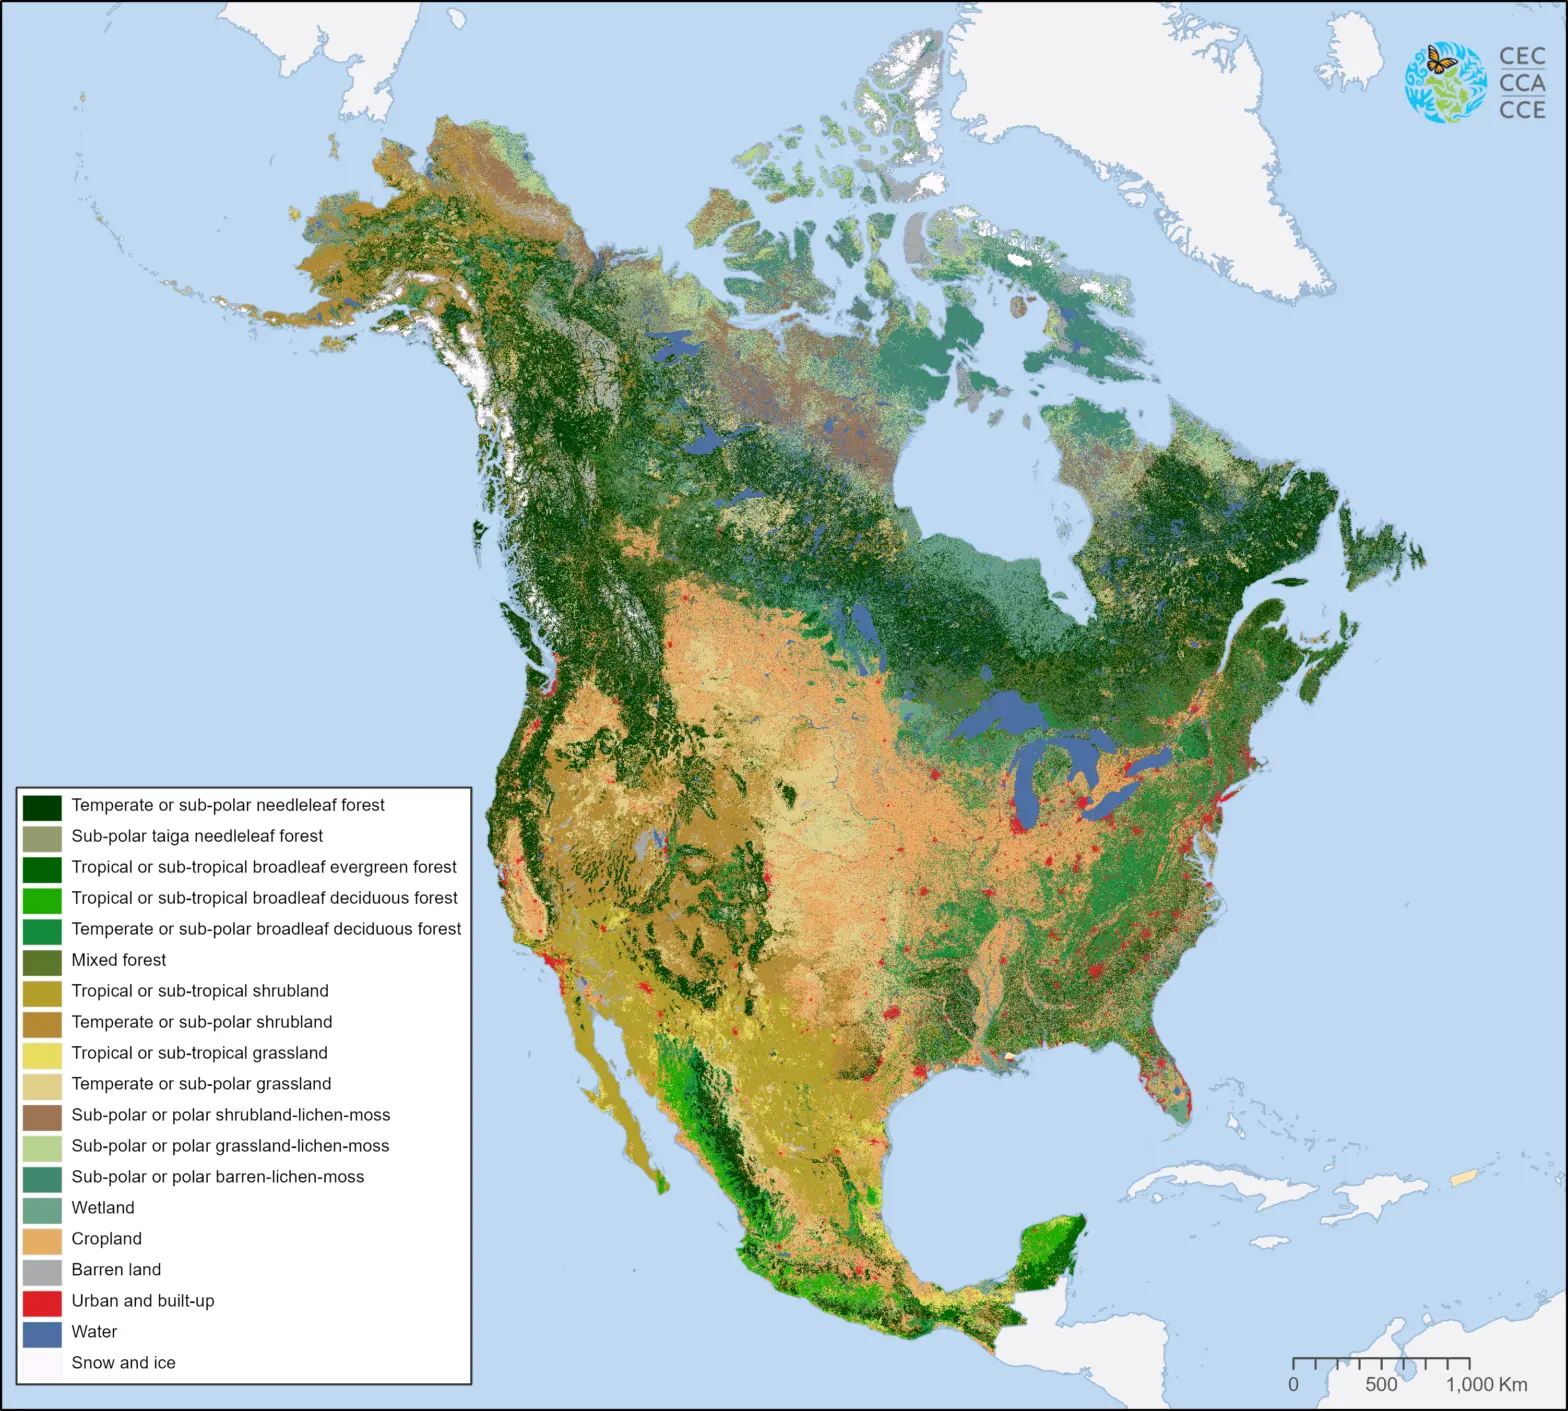
This map of North American land cover at a spatial resolution of 30 meters provides...
2024
Land Cover
This map of North American land cover at a spatial resolution of 30 meters provides...
2024
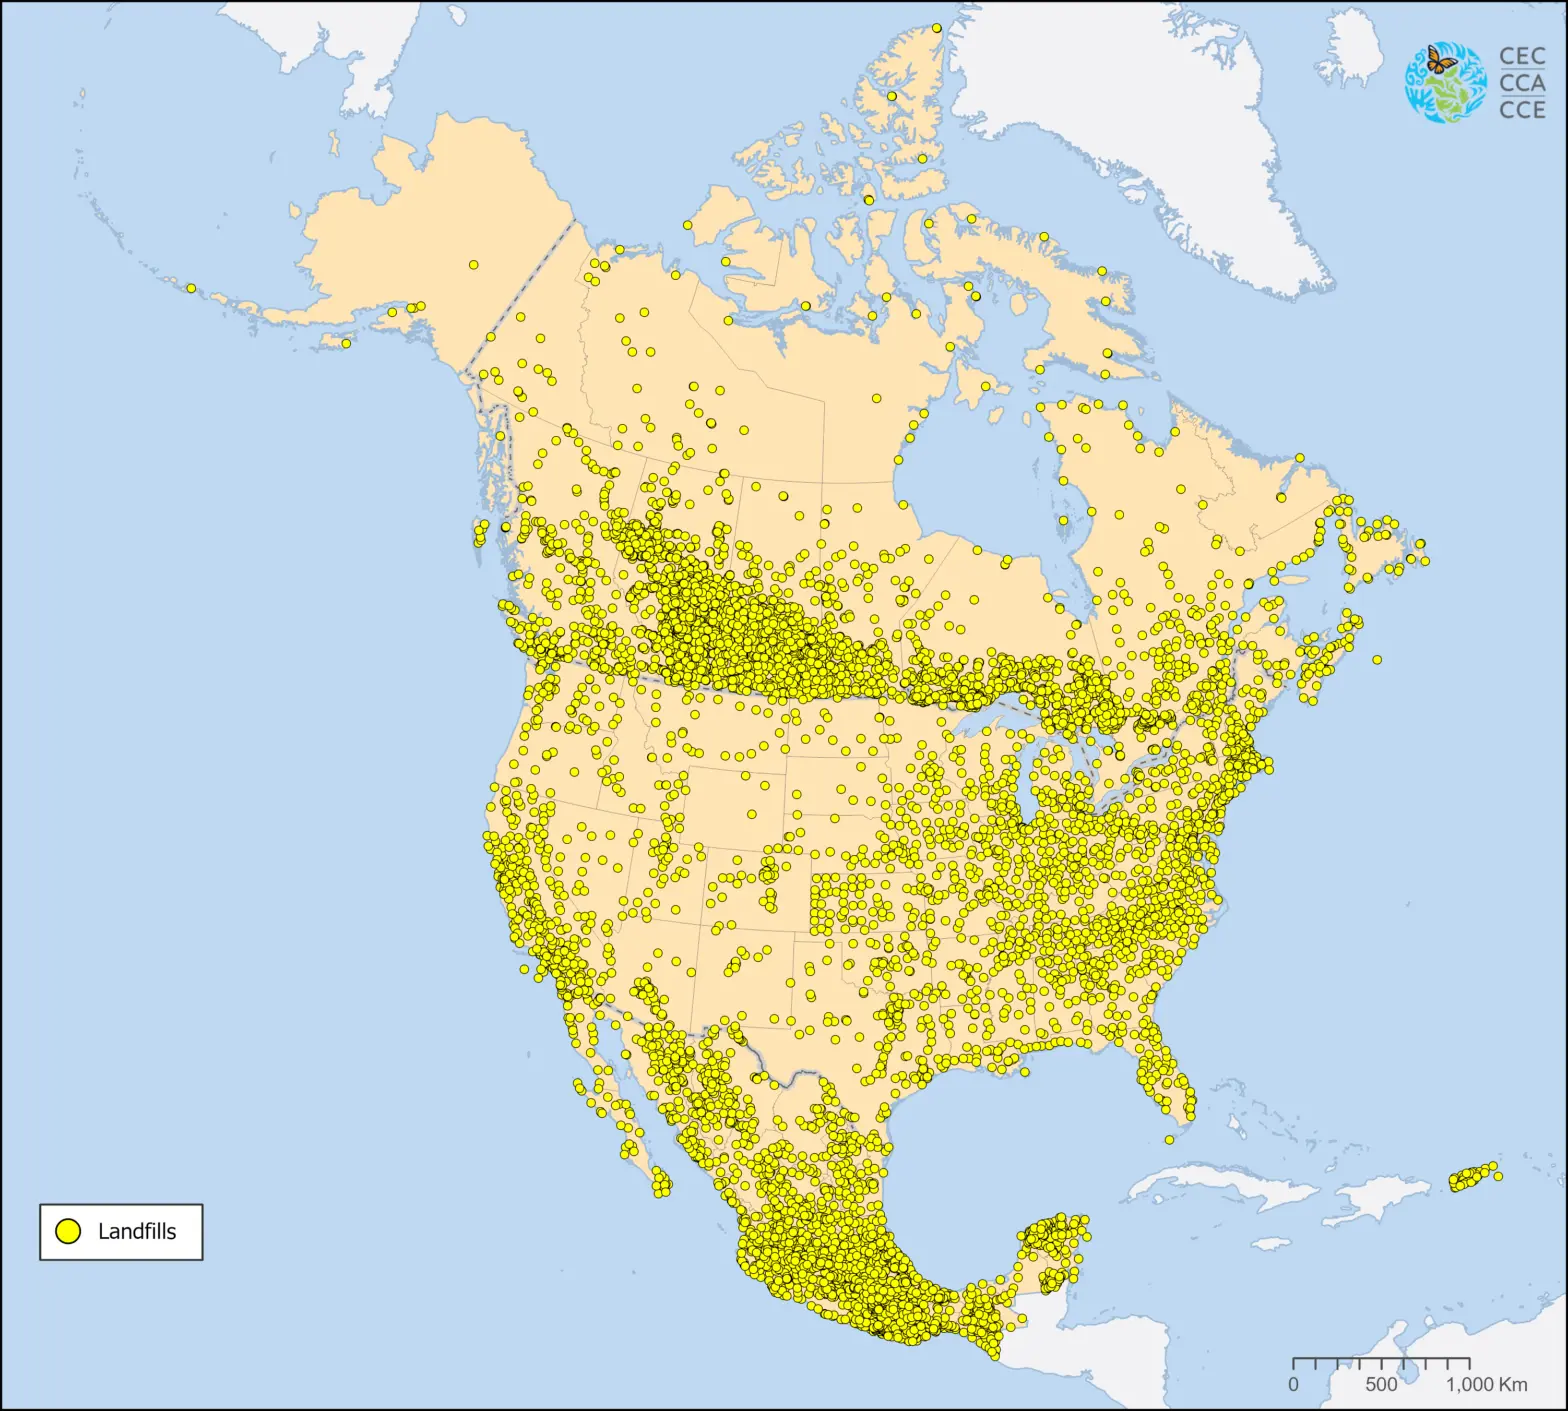
Pollutants
The North American Landfills dataset represents the approximate location of known landfills and dumpsites (open...
2024
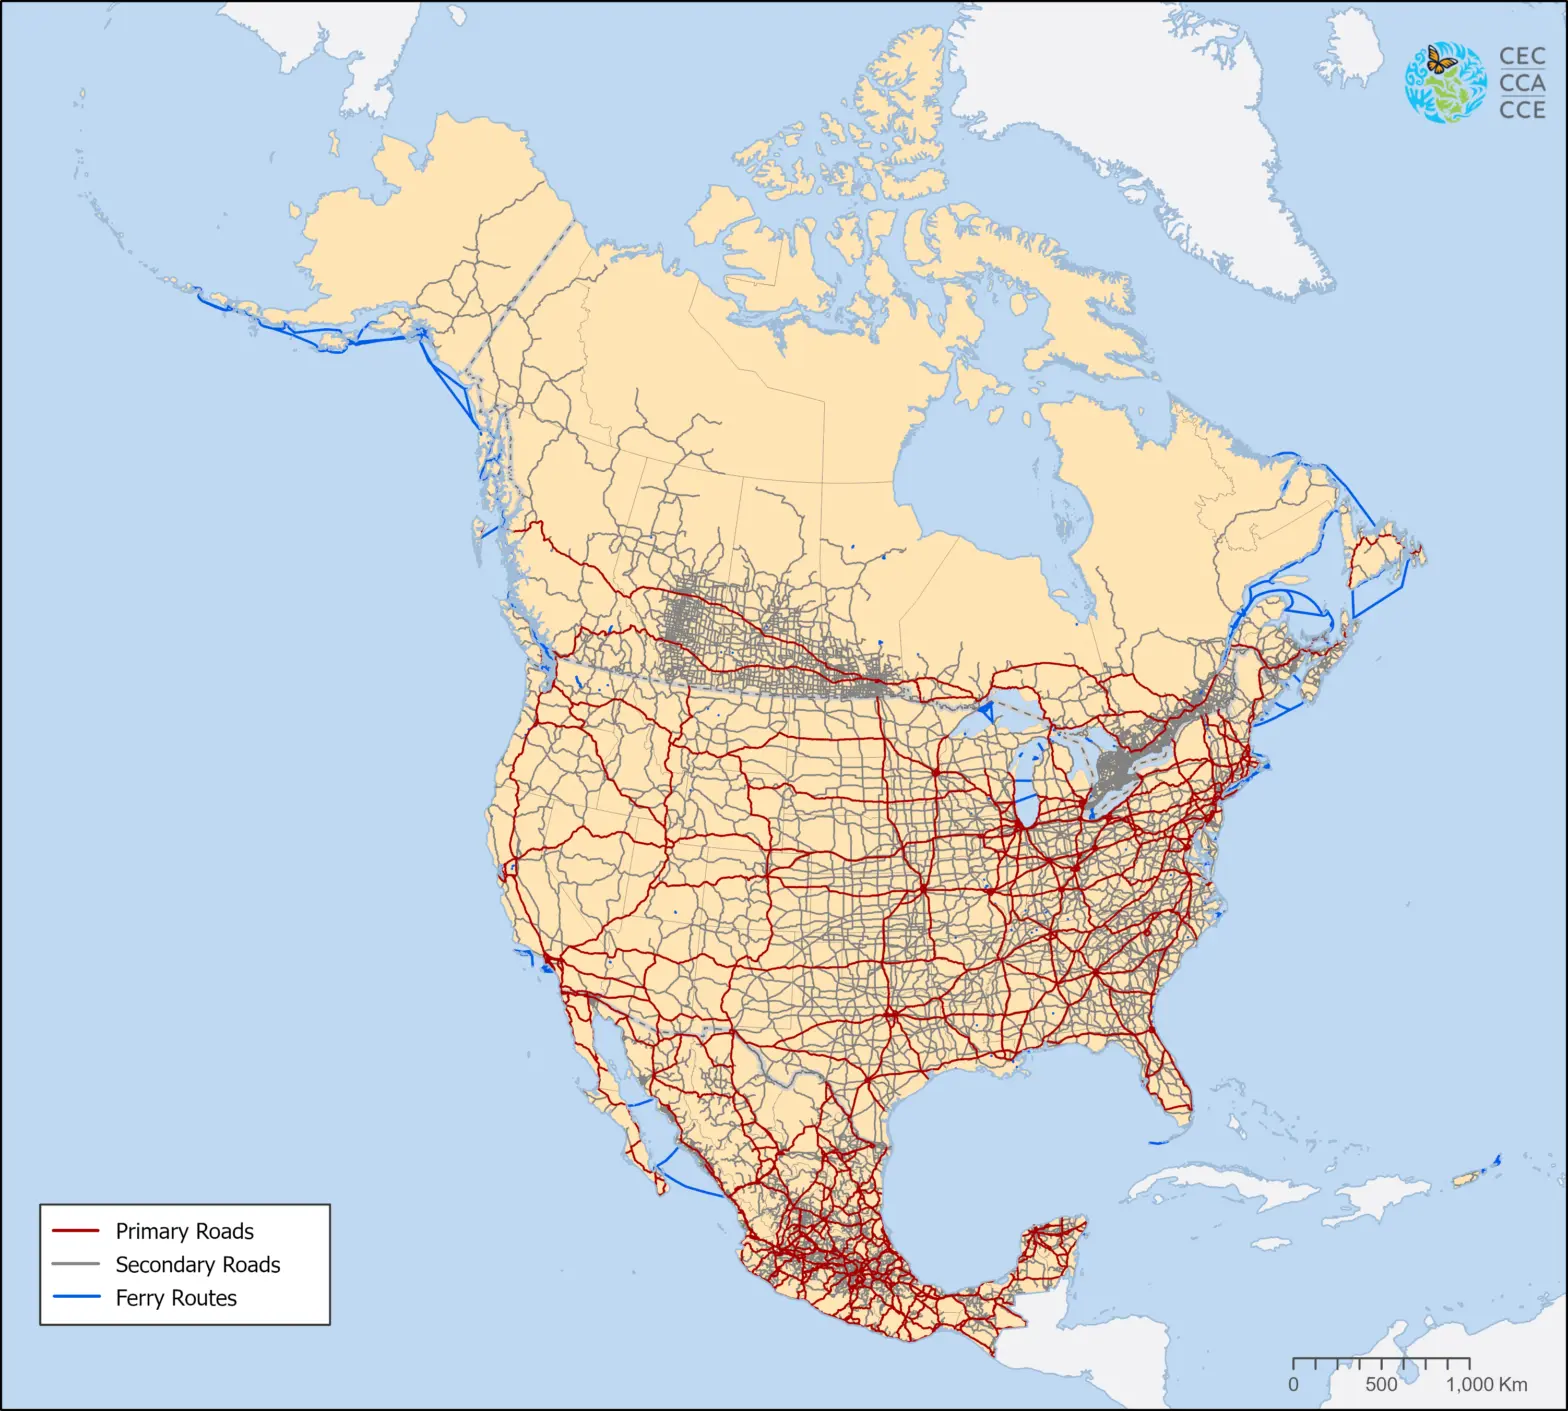
Transportation
As part of the North American Environmental Atlas, this reference dataset displays the roads network...
2024
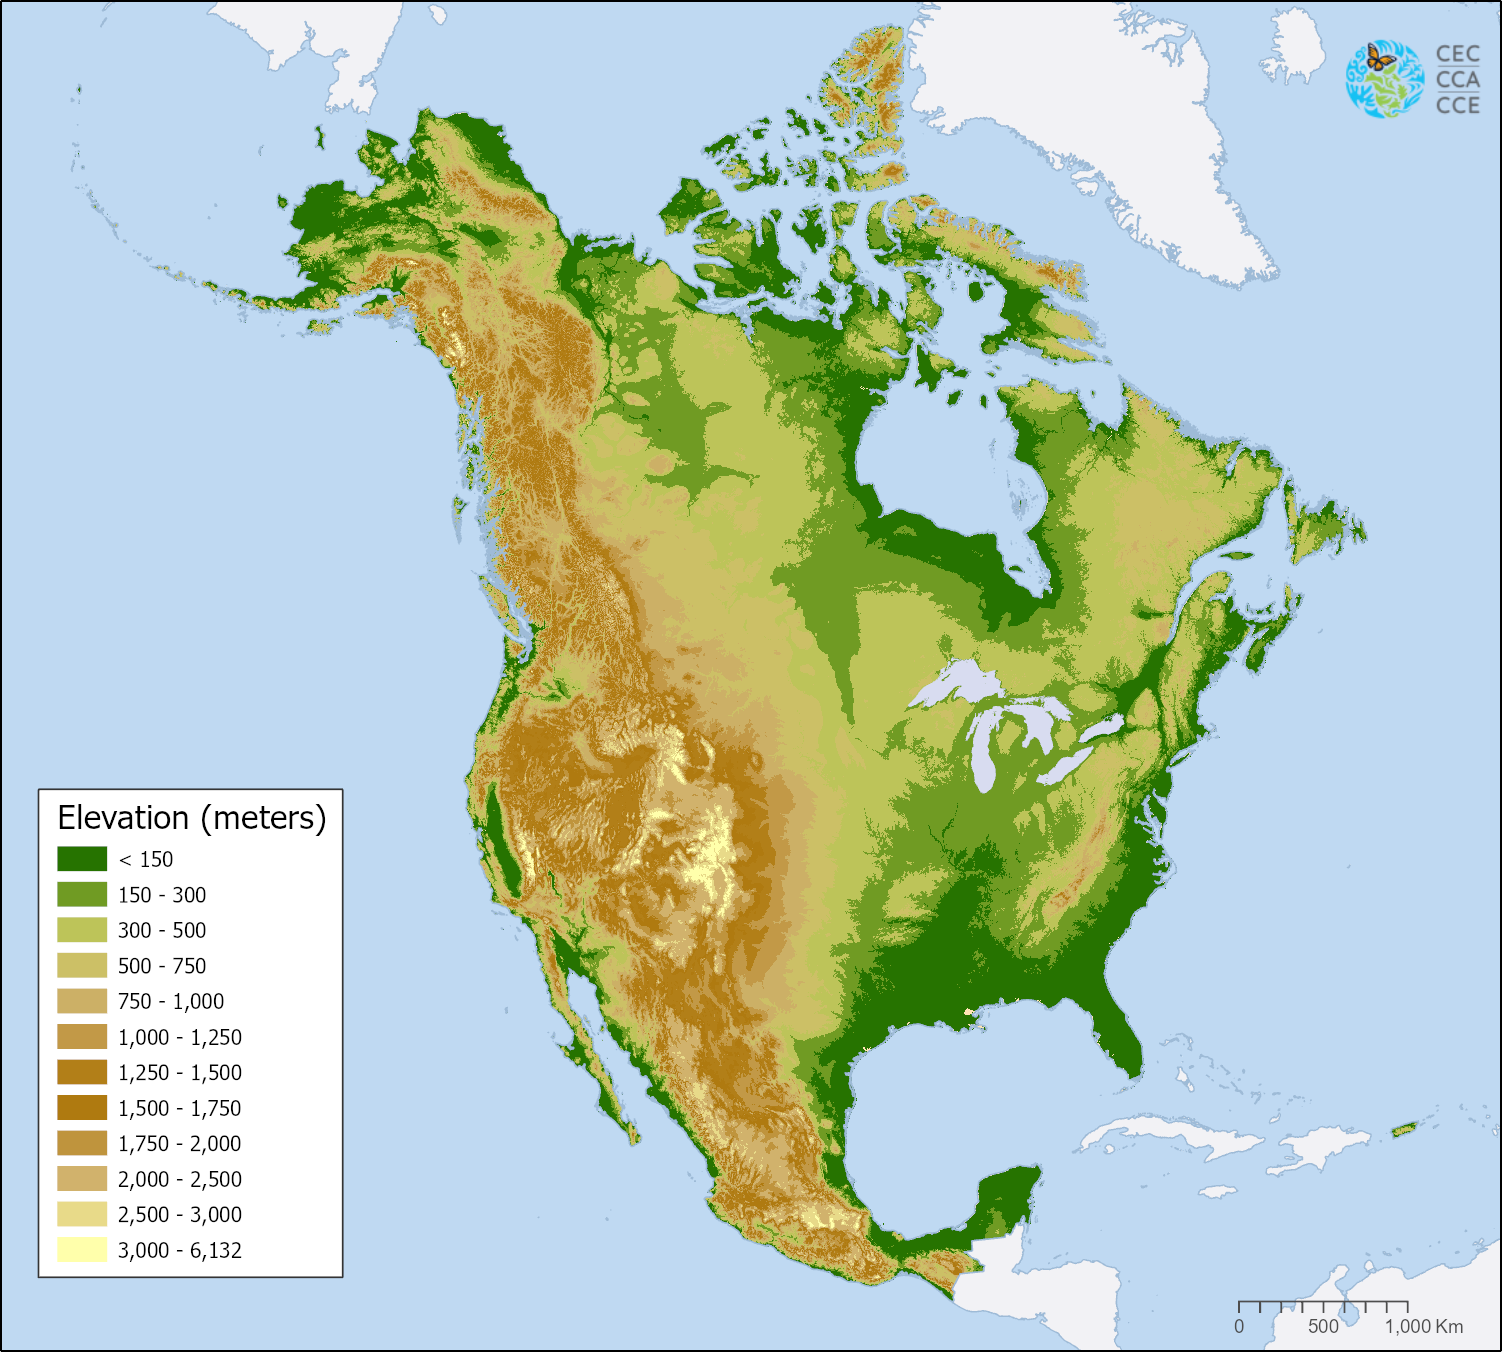
Ecoregions, Land Cover
The 250m elevation map of North America illustrates the region's terrain in relation to mean...
2023
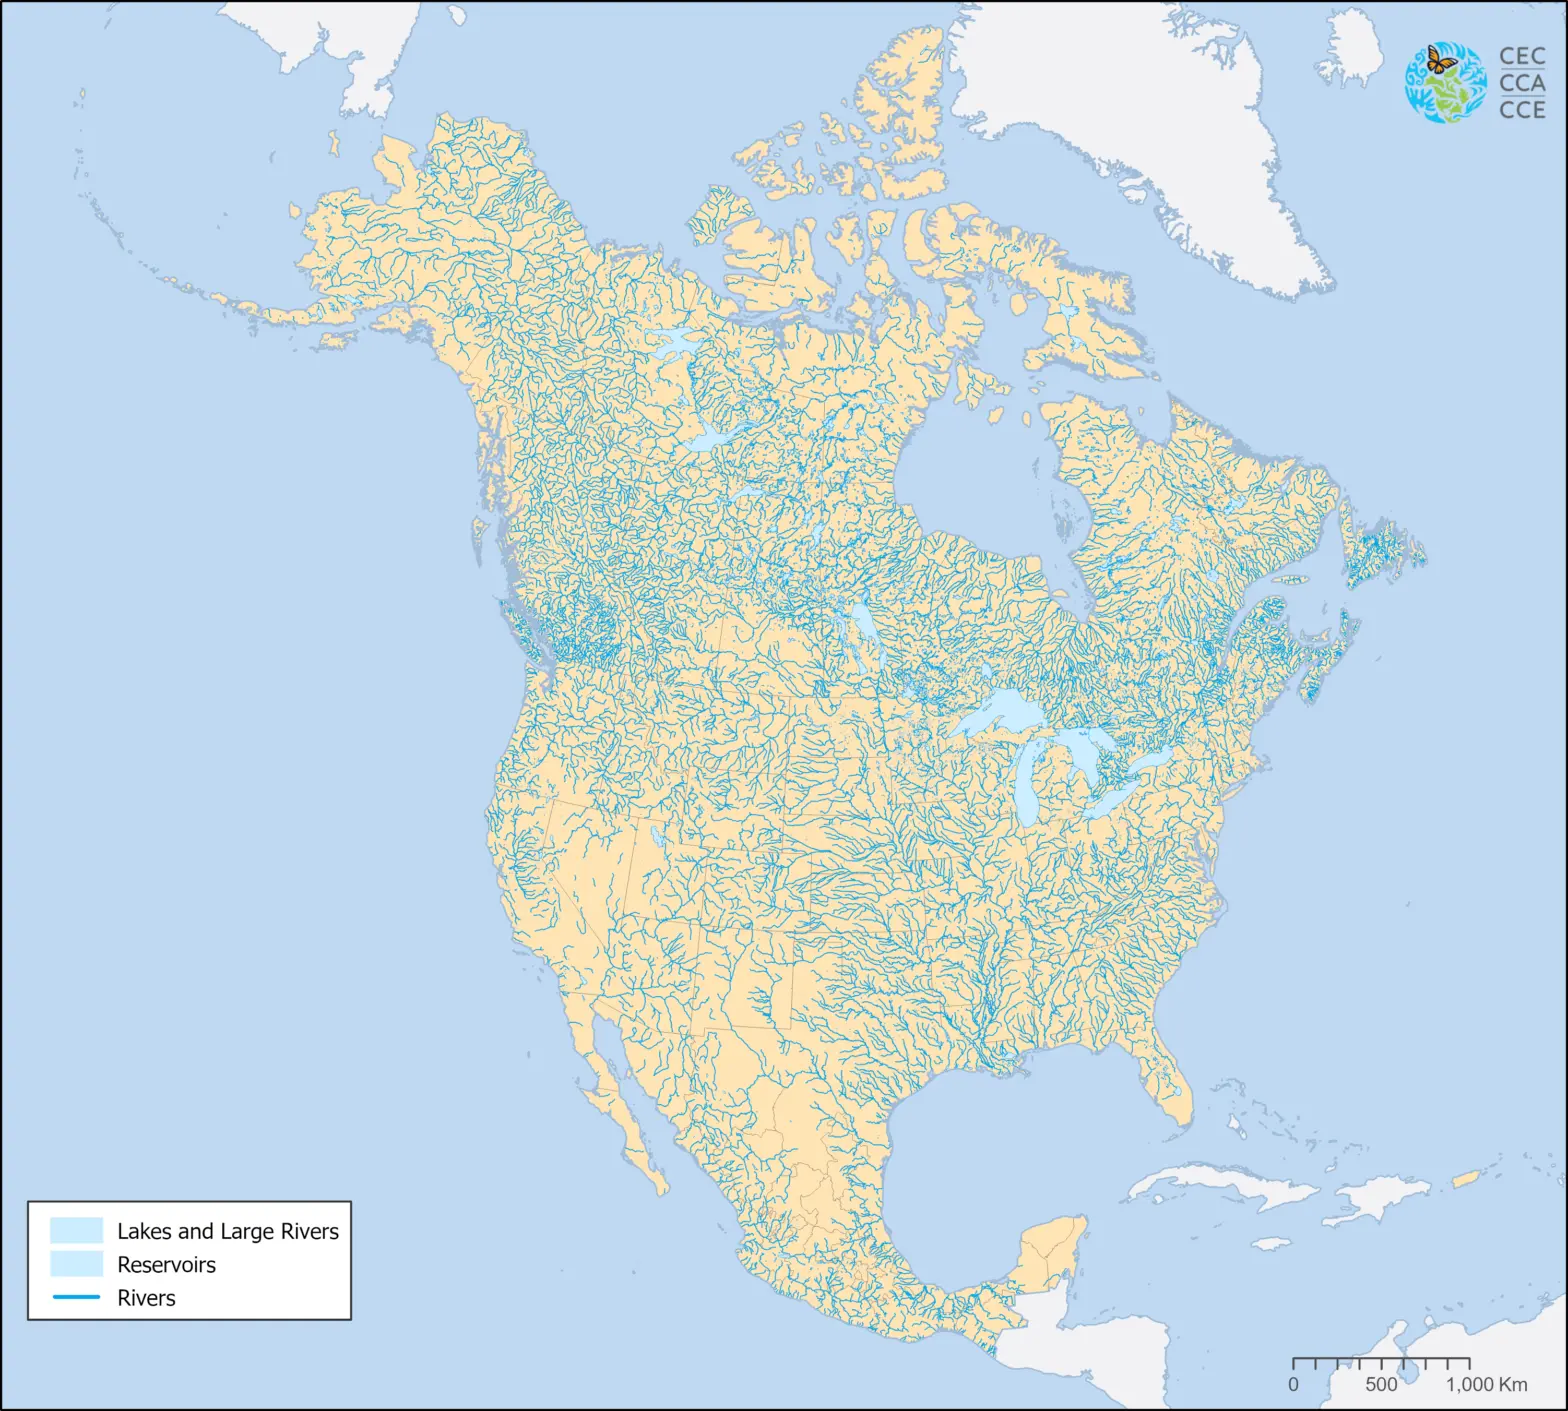
Water
This North American Environmental Atlas dataset displays the coastline, linear hydrographic features (major rivers, streams,...
2023