2.4 Analysis of Off-site Transfers to Disposal, 2014–2018
2.4 Analysis of Off-site Transfers to Disposal, 2014–2018
2.4.5 Transfers to disposal in the United States
Transfers to disposal reported by US facilities declined by about 5% during this period —from approximately 223 million kg in 2014 to about 211 million kg in 2018 (Table 13)— and represent more than 200 industrial sectors and approximately 300 pollutants each year. Compared with Canada and Mexico, the United States stands out in terms of the number of facilities and pollutants included in its PRTR data, reflecting the country’s sizeable industrial base, as well as the fact that the TRI program covers more than 700 substances.
Figure 20 shows that together, ten industry sectors accounted for approximately two-thirds of all transfers to disposal in 2018, with three of them—the iron and steel mills/ferroalloy manufacturing, electricity generation, and waste management sectors—representing 42% of the total that year. It also shows that transfers to landfills or surface impoundments was the dominant off-site disposal practice in this country.
Figure 20. Transfers to Disposal by Sector, Pollutant, and Disposal Category, United States, 2018
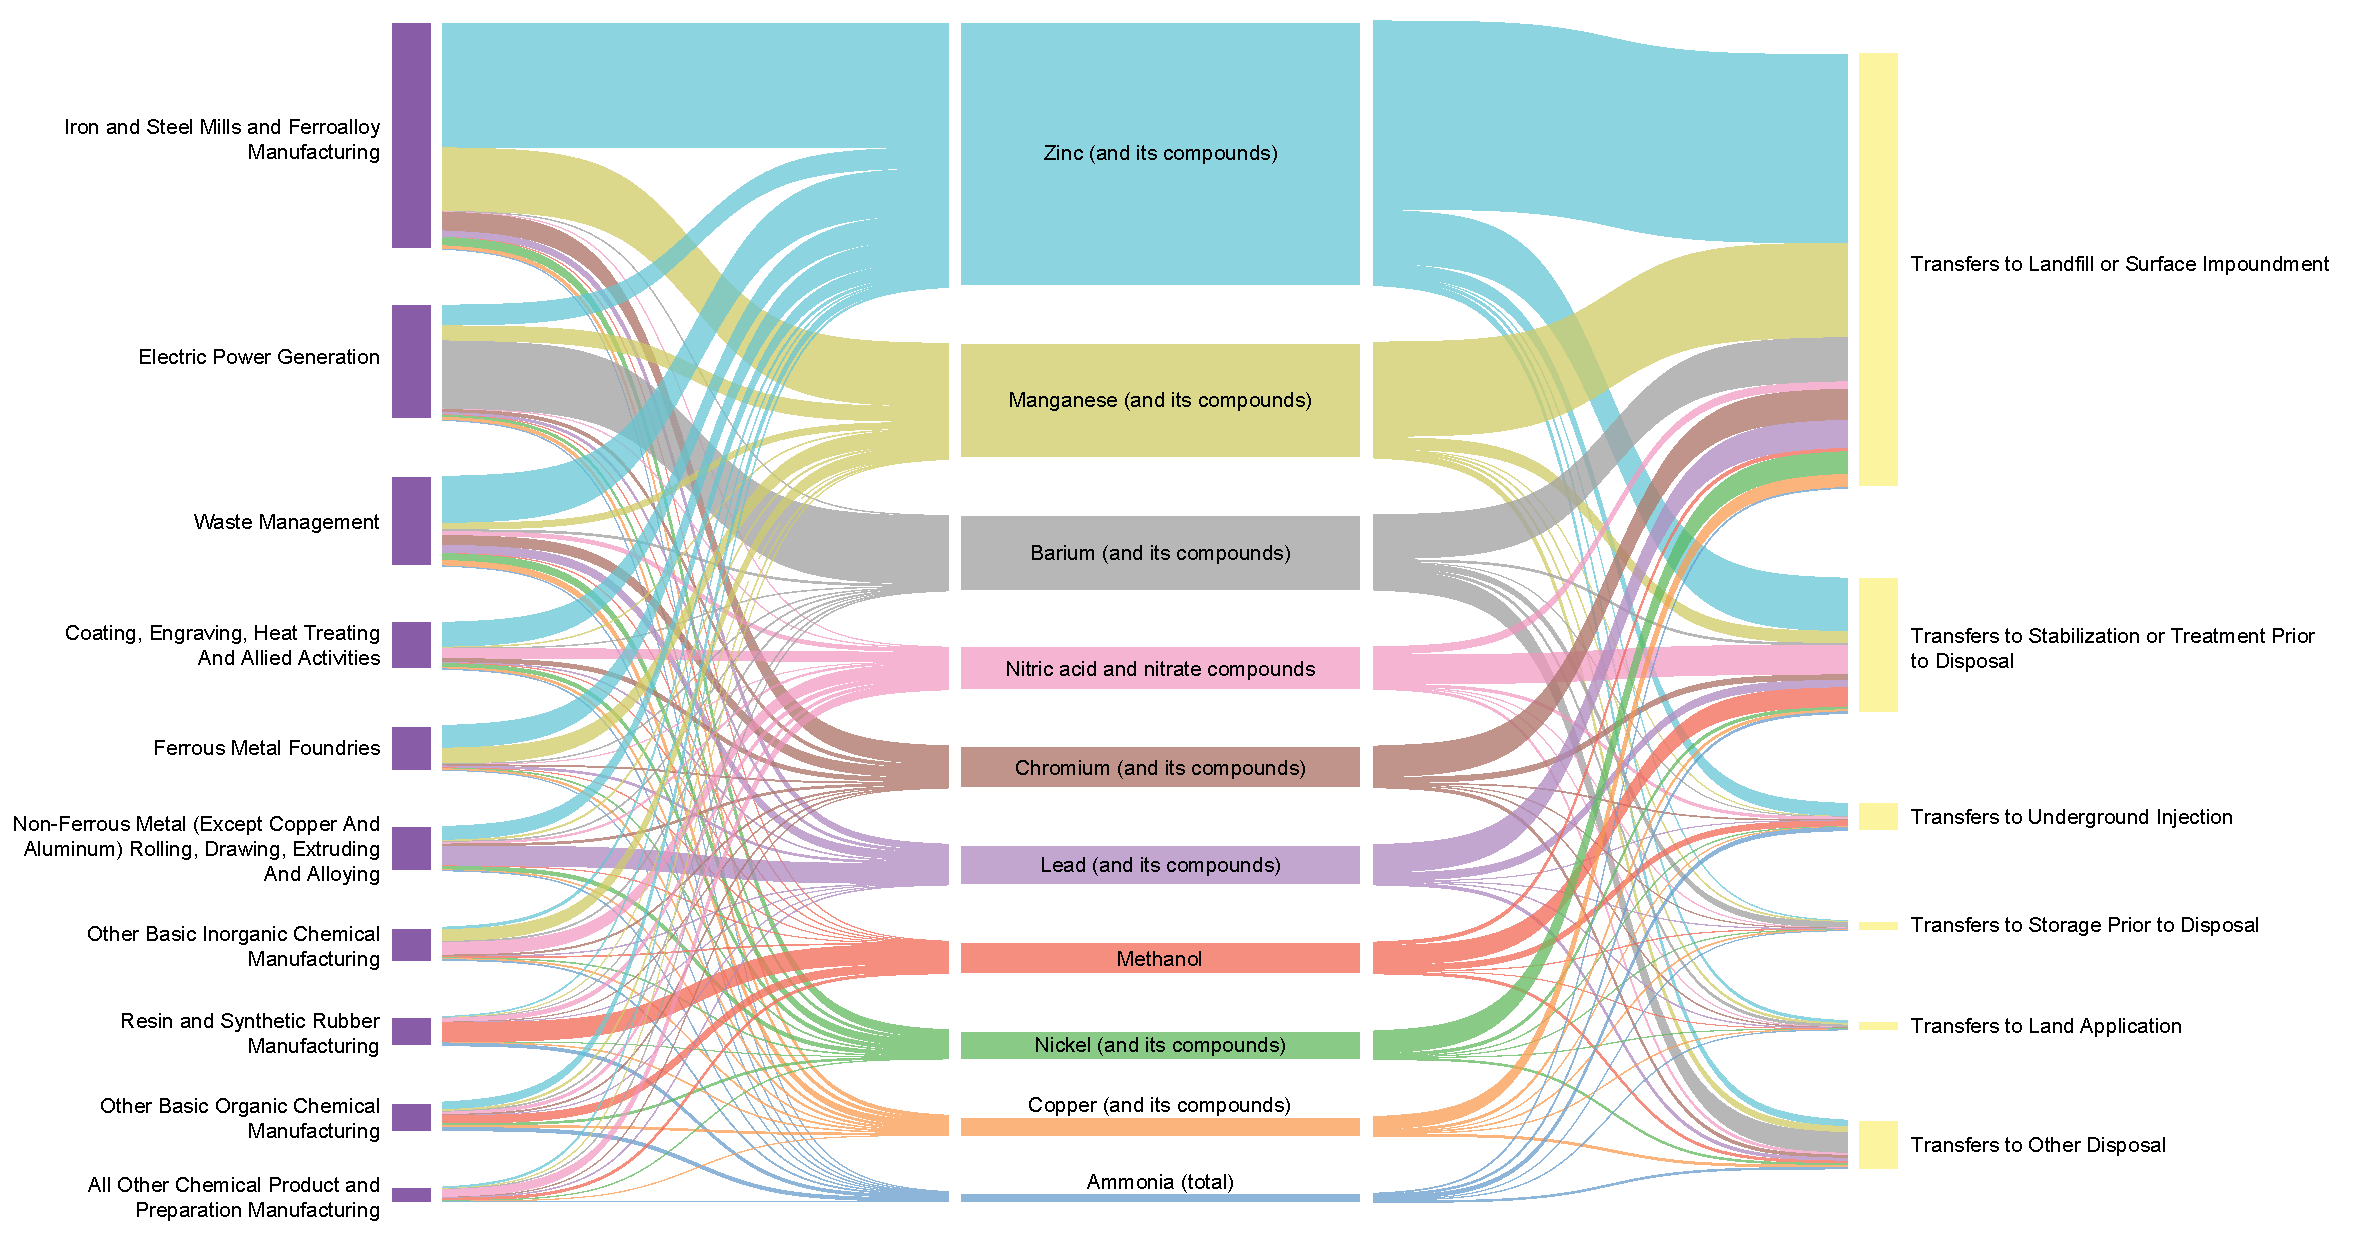
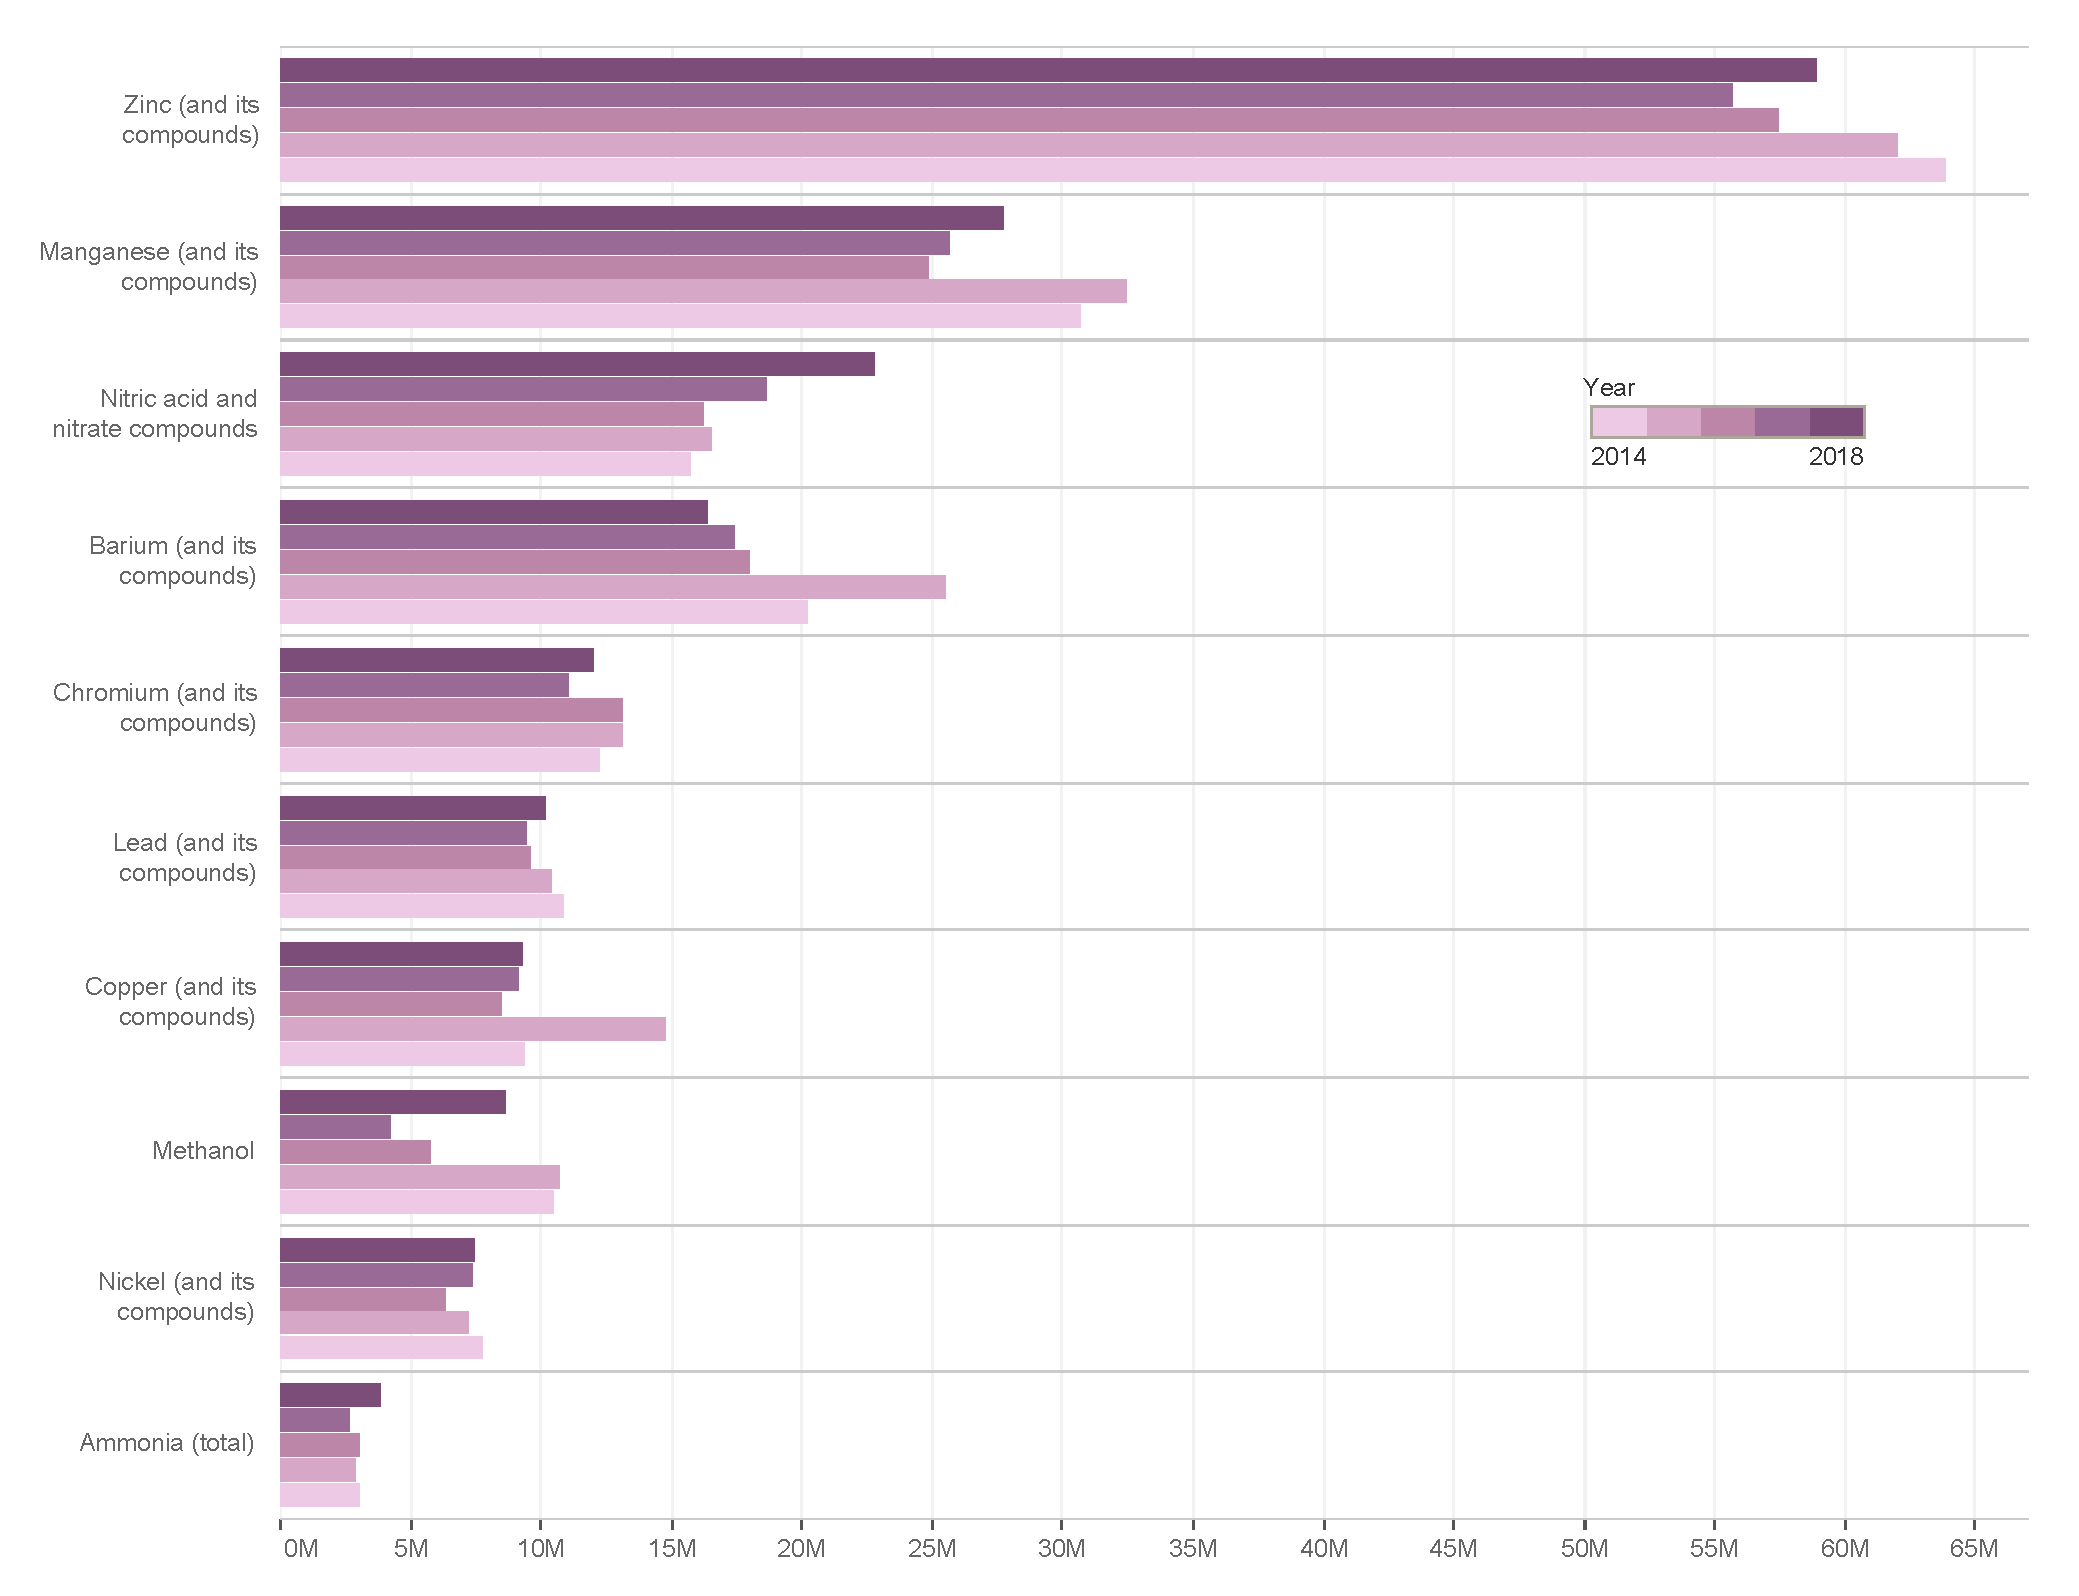
Figures 21a and 21b show how transfers to disposal in the United States changed between 2014 to 2018. Three sectors (iron and steel mills/ferroalloy manufacturing, electric power generation, other basic organic chemical manufacturing) drove the decline in transfers to disposal during this period, with zinc, manganese, and barium compounds associated with this decline.
Figure 21a. Transfers to Disposal in the United States: Top Sectors, 2014–2018
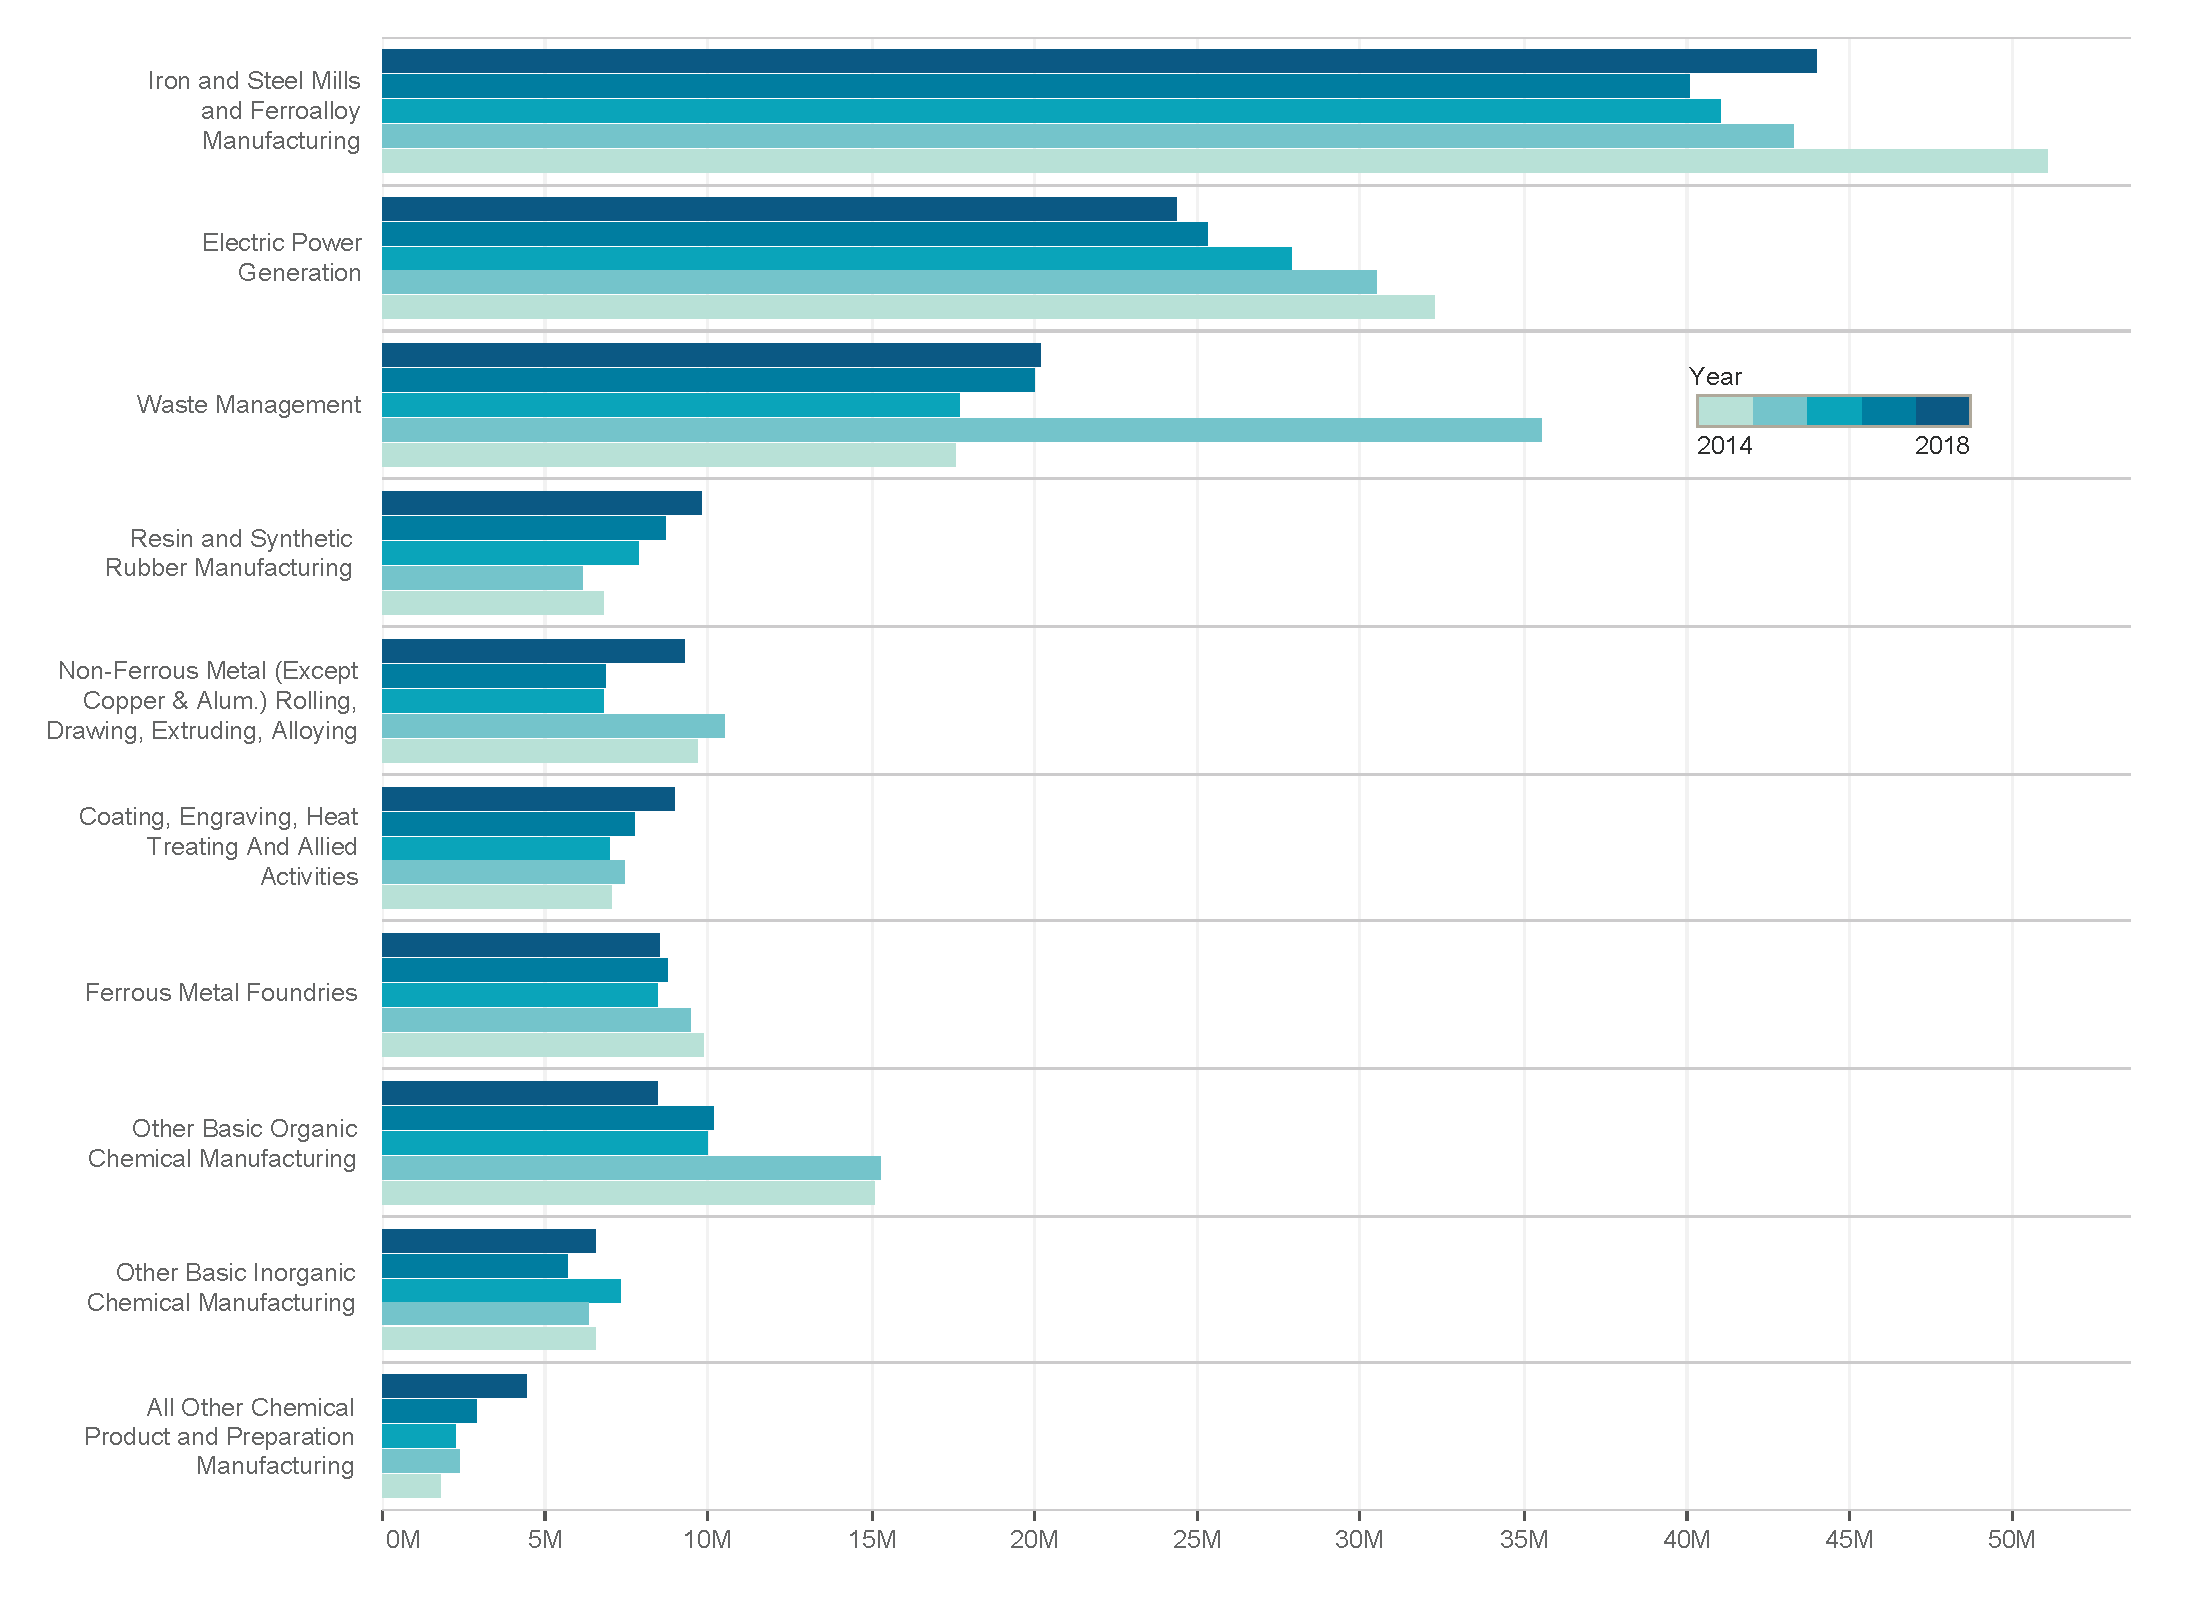
Figure 21b. Transfers to Disposal in the United States: Top Pollutants, 2014–2018
A comparison of the top sectors in both the United States and Canada reveals that the two countries have a great deal in common, if one considers the following factors influencing their PRTR data:
- The electric power generation sector, which ranks second for transfers to disposal in the United States, is highly dependent on fossil fuels such as coal. In comparison, a significant portion of Canada’s energy needs are supplied by hydroelectricity and therefore, this sector figures less prominently in the NPRI data (with 55 Canadian power plants reporting compared with about 575 facilities in the United States); and
- The oil and gas extraction and sewage treatment sectors—two of the top sectors for transfers to disposal in Canada—are not subject to reporting in the United States.
If we exclude the above sectors, the iron and steel mills/ferroalloy manufacturing and waste management industries are the top sectors for transfers to disposal in both the United States and in Canada. Using PRTR data and other information available for common industry sectors in the region—relative to their processes, the generation of waste needing to be managed, and strategies for reducing waste –can inform policies and actions to further support and promote pollution prevention efforts and the transition to a more sustainable economy.
Between 2014 and 2018, 139 facilities in the iron and steel mills/ferroalloy manufacturing sector (NAICS 33111) reported transfers to disposal, primarily to landfills/surface impoundments or stabilization or treatment prior to disposal. Table 30 shows the five top facilities for each of these disposal categories.
Table 30. Transfers to Landfills/Surface Impoundments or Stabilization/Treatment prior to Disposal by Top Facilities in the US Iron and Steel Mills/Ferroalloy Manufacturing Sector (NAICS 33111), 2014–2018
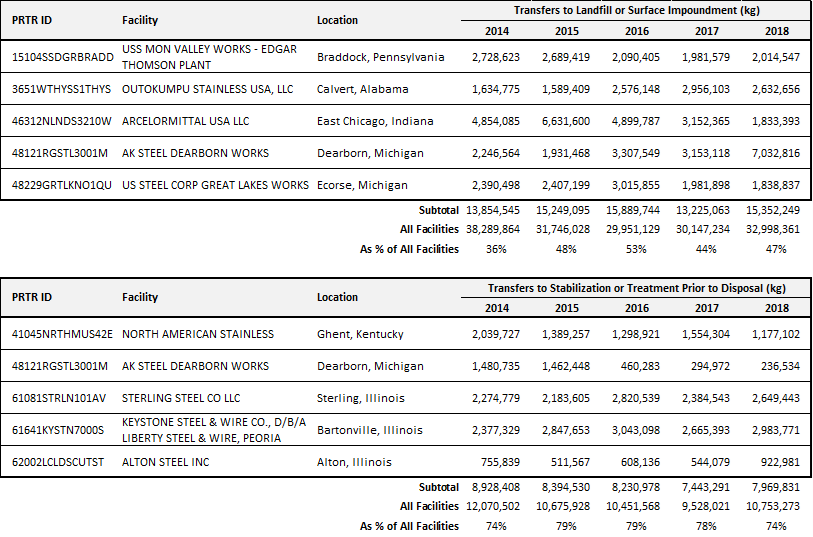
Like this Canadian sector, the main substances reported by US facilities were zinc and manganese compounds, followed by lead, copper, and chromium compounds. However, in contrast with facilities in Canada, US facilities transferred the largest proportions (more than 80% each year) of their zinc compounds—the top reported substance for this sector—to recycling (Table 31). As mentioned in the discussion of the Canadian data for this sector (section 2.4.3), it could be useful to know the reasons for the difference in waste management methods used by a common sector in the region (for example, local availability of infrastructure, regulations).
Table 31. Disposal (On- and Off-site) and Recycling of Zinc Compounds by the Canadian and US Iron and Steel Mills/Ferroalloy Manufacturing Sector (NAICS 33111), 2014–2018
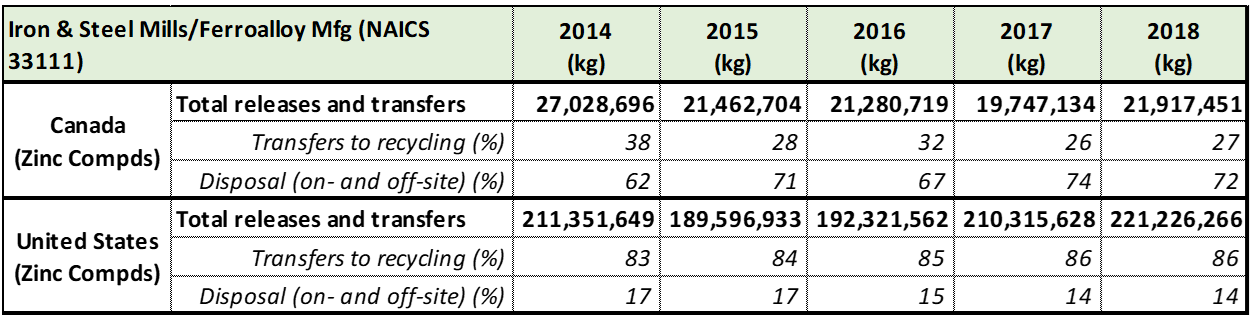
Note: Differences among national reporting requirements need to be considered when interpreting North American PRTR data.
The electricity generation sector (NAICS 22111) ranked second in the United States for off-site transfers to disposal, mainly to landfill/surface impoundments. There was a significant decrease (of almost 25%) in these transfers during this period, reflecting a progressive reduction in total releases and transfers by this sector. It also reflects a decline in the number of reporting utilities, from 540 in 2014 to 461 in 2018. As described in Taking Stock, Volume 14, many coal-fired power plants have had to shift to cleaner fuel sources or shut down as a result of stricter emissions standards for mercury and other hazardous air pollutants put in place in the United States in the last decade.[64]
The pollutants reported by these facilities, such as barium, zinc, manganese, vanadium, copper, and chromium compounds, are contained in the ash generated by the burning of coal. While important proportions of these pollutants are prevented from being released to the air through the use of control technologies, the resulting ash must be disposed of in some way.
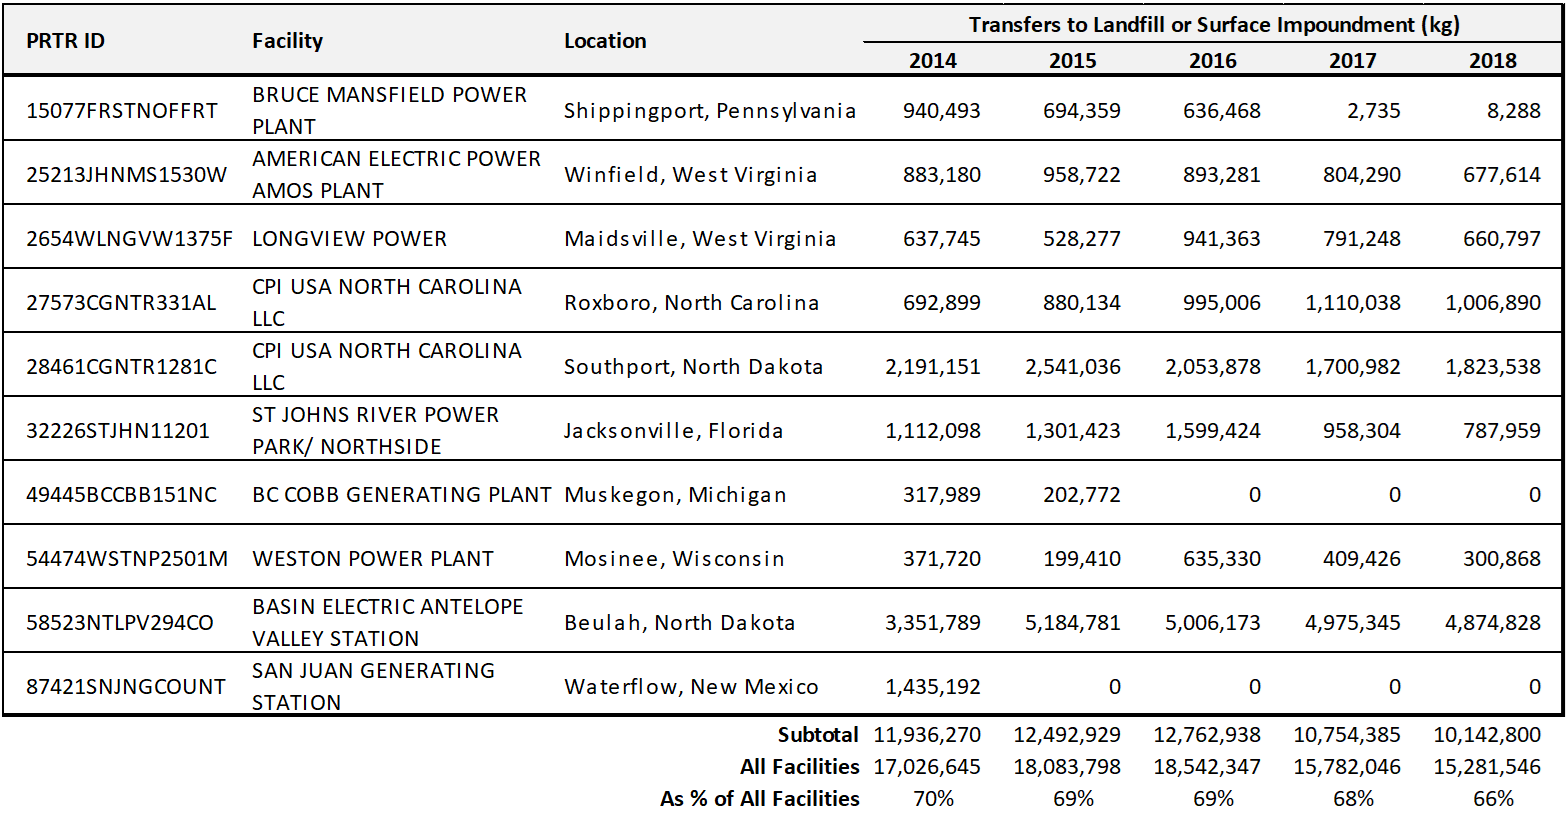
Table 32 shows the ten power plants that together accounted for approximately 70% of all transfers to landfills or surface impoundments between 2014 and 2018 (with one facility, the San Juan plant in New Mexico, also sending significant proportions of its waste to storage prior to disposal). Notwithstanding these off-site transfers, most US power plants dispose of their waste in landfills or surface impoundments on site.
Table 32. Transfers to Landfills/Surface Impoundments by Top Facilities in the US Electric Power Generation Sector (NAICS 22111), 2014–2018
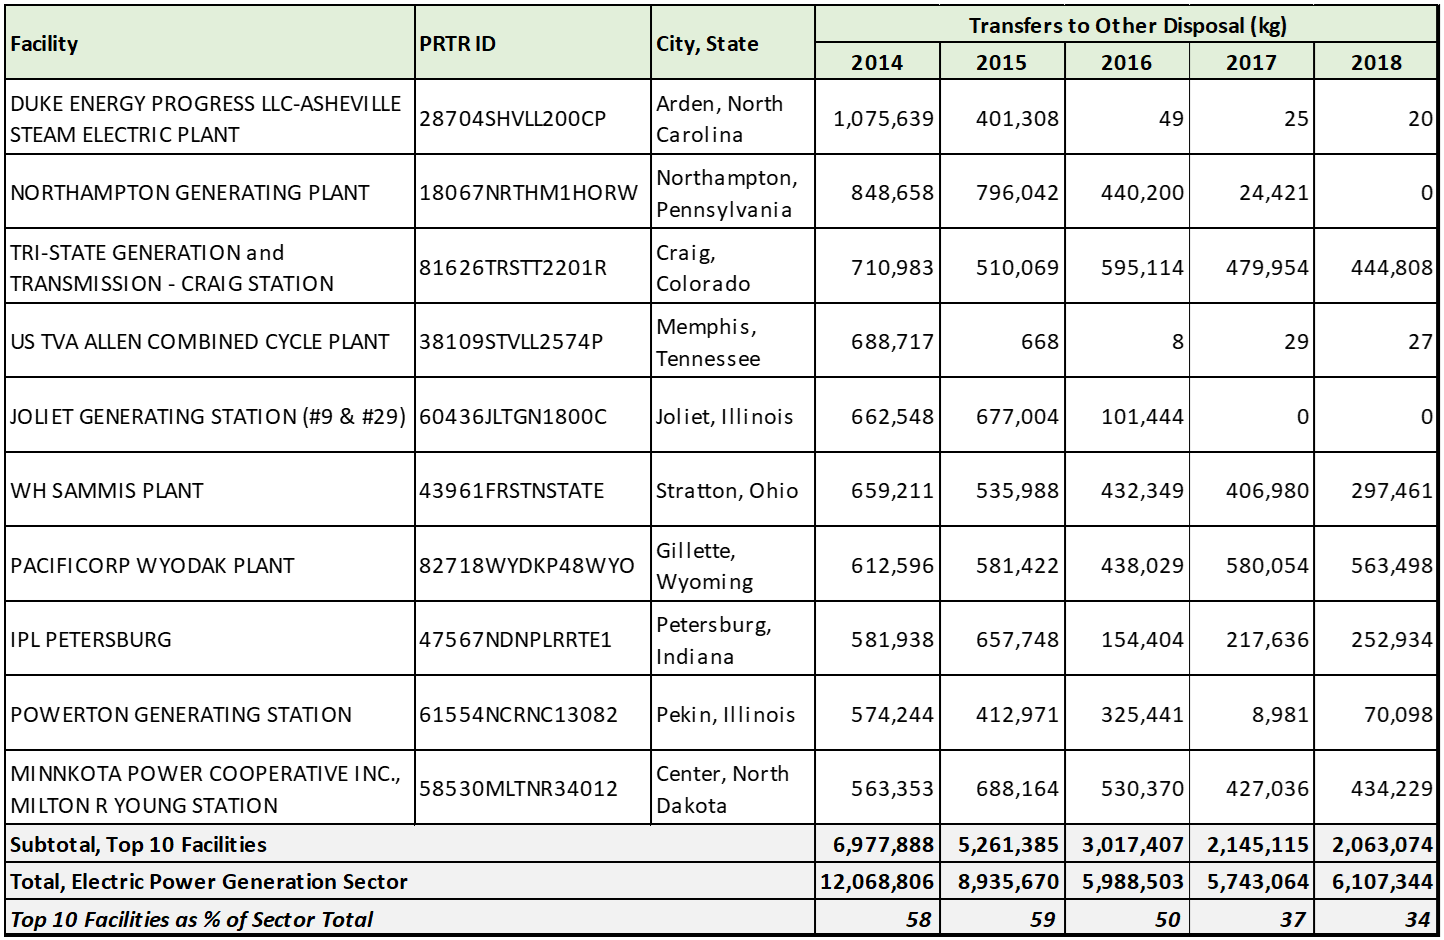
Certain power plants also reported transfers to “other disposal (unknown)” during this period, which, in keeping with the overall trend for the sector, declined from just over 12 million kg in 2014 to approximately 6 million kg in 2018 (Table 33). This decrease can be attributed to fewer reporting facilities overall (as mentioned earlier), as well as to specific facilities such as the Duke Energy–Asheville power plant in North Carolina. This facility reported just over 1 million kg in transfers to other disposal in 2014, but in the following years transferred most of its waste barium, vanadium, and other metal compounds to landfill or surface impoundments.[65]
Table 33. Transfers to “Other Disposal (Unknown)” by Top Facilities in the US Electric Power Generation Sector (NAICS 22111), 2014–2018
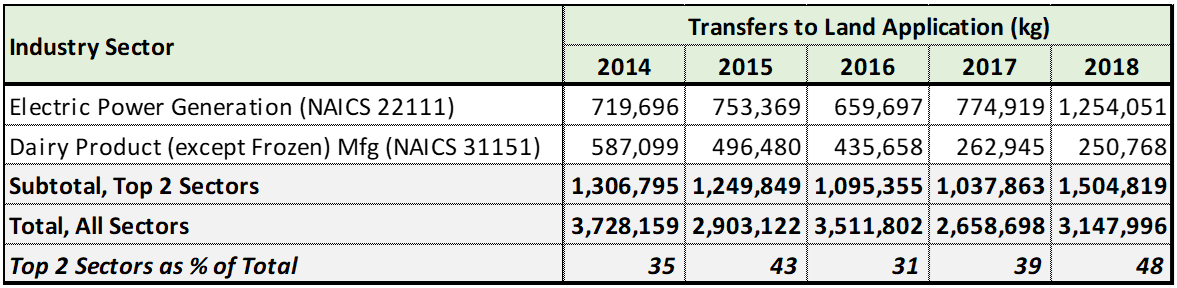
Electric utilities were also the top-ranking sector for transfers to land application during this period (reporting mainly metal compounds such as barium, manganese, vanadium, and zinc). The amounts reported by this sector, together with those of the dairy product manufacturing sector (NAICS 31151)—99% of which were nitric acid/nitrate compounds—accounted for approximately one-third of all transfers to land application in the United States (Table 34).
Table 34. Transfers to Land Application (Land Treatment) by the Top US Sectors, 2014–2018
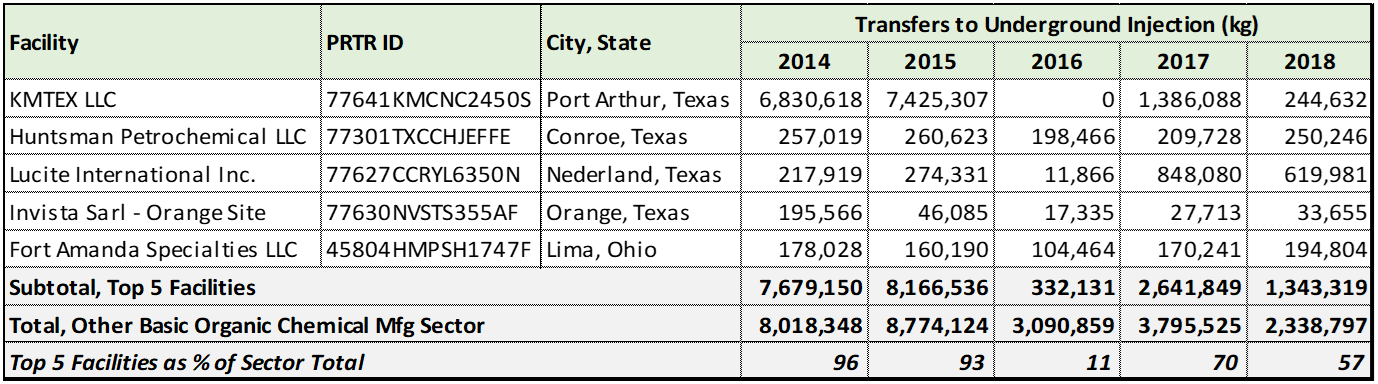
Of the more than 600 facilities in the other basic organic chemical manufacturing sector (NAICS 32519) that reported during this period, five accounted for 7.6 million kg in 2014 (or about 96% of all transfers to underground injection by the sector that year). These transfers declined by more than 82% over this period (to about 1.3 million kg in 2018) (Table 35).
Among the top pollutants transferred to underground injection by this sector each year were methanol, ammonia, methyl methacrylate, cyclohexane, acrylamide, and formaldehyde, followed by approximately up to 40 other substances. The large decrease during this period was driven by one facility, KMTEX LLC, located in Texas—the result of an overestimation of the amount of methanol in 2014 and 2015 (according to a query of the TRI data).
Table 35. Transfers to Underground Injection by Top Facilities in the US Other Basic Organic Chemical Manufacturing Sector (NAICS 32519), 2014–2018
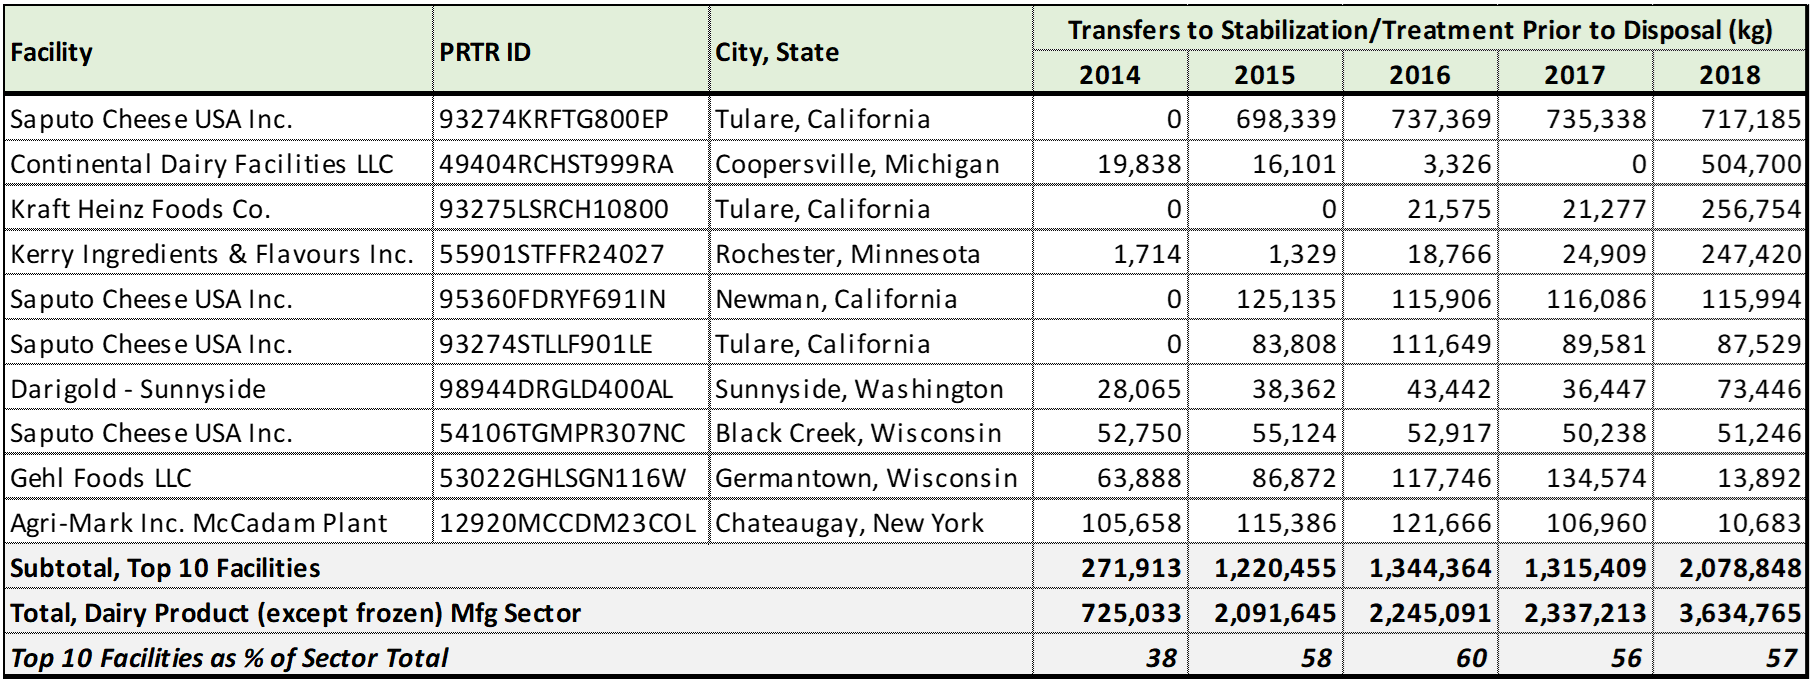
The top US sector for transfers to stabilization or treatment prior to disposal during this period was the dairy product (except frozen) manufacturing sector (NAICS 31151), whose transfers increased from about 725,000 kg in 2014 to more than 3.6 million kg in 2018, mainly due to a few facilities (Table 36). Nitric acid/nitrate compounds, which are used as preservatives or antibacterial agents for cheese, comprised more than 95% of these transfers and drove the increase during this period. Other pollutants, including sodium nitrite, ammonia, periacetic acid, zinc compounds, methanol, toluene, and certain glycol ethers, were also reported by this sector.
Table 36. Transfers to Stabilization or Treatment by Top Facilities in the US Dairy Product (except Frozen) Manufacturing Sector (NAICS 31151), 2014–2018
The third-ranked sector for transfers to disposal in the United States was the waste management sector (NAICS 562), particularly for transfers to landfill or surface impoundments. A total of approximately 65 facilities in this sector reported each year, with amounts increasing from about 14.7 million kg in 2014 to 19.6 million kg in 2018, except for 2015 (Table 37).
Table 37. Transfers to Landfill/Surface Impoundments by Top Facilities in the US Waste Management Sector (NAICS 562), 2014–2018
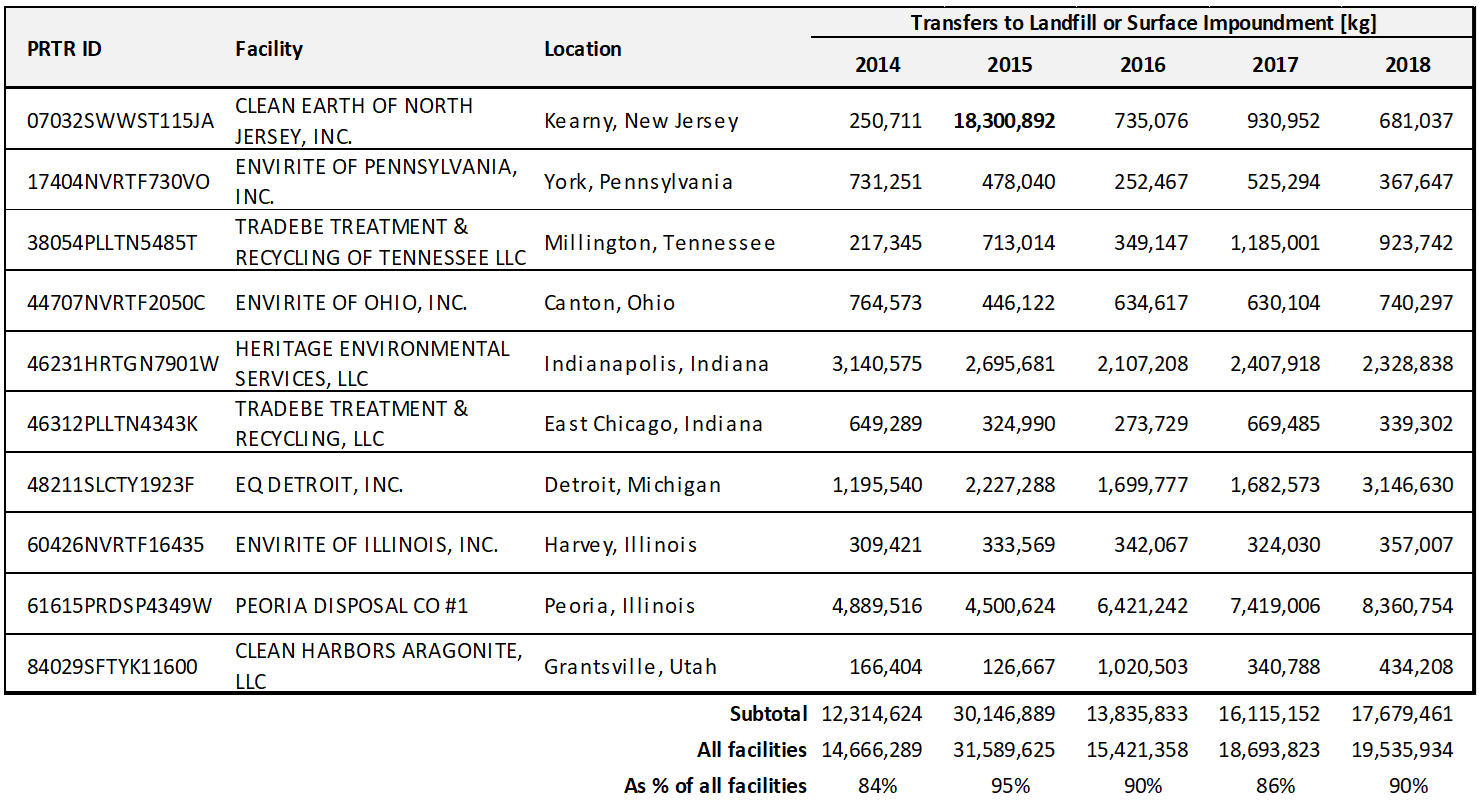
This table shows that ten facilities accounted for more than 80% of the total each year and that the large increase in 2015 was driven by one facility, Clean Earth of North Jersey, Inc., which reported 18.3 million kg that year following a remediation project involving several petrochemical facilities. It reported about 5 million kg each of copper, barium, and manganese compounds, along with smaller proportions of lead, nickel, and chromium compounds.
Other pollutants transferred to landfill/surface impoundments by this sector were zinc compounds, aluminum oxide, nitric acid/nitrate compounds, certain glycol ethers, diisocyanates, ethylene glycol, and others. While these transfers increased during this period, the number of pollutants decreased (from 229 in 2014 to just over 160 in each of the subsequent years). In many cases, these pollutants were either disposed of in landfills or surface impoundments on site or transferred to treatment.[66]
As mentioned earlier, the waste management sector often handles hazardous substances requiring some form of treatment or stabilization prior to their disposal. Not all facilities in this sector have specialized processes and technologies allowing them to handle, treat and dispose of the large variety of wastes they encounter as service providers to many different industry sectors—including petroleum refineries, oil and gas extraction facilities, mines, power plants, sewage treatment facilities, and a wide range of manufacturing sectors. Therefore, it is common for waste management facilities to serve as intermediaries, transferring parts of the waste they receive to other establishments for treatment or disposal. Transfers involving a third party, such as a waste management service provider, can make it difficult to track the ultimate disposition of pollutants after they leave the source facility. This is illustrated in the following example.
For various reasons, the waste handled by any of the operations above might not be reported to a PRTR program; for instance, it might have been mixed with other compatible waste to minimize its negative effects and therefore, no longer meet reporting requirements. Such factors contribute to the difficulty of tracking the fate of pollutants once they have been transferred off the site of the source facility. Examples from the cross-border transfers data presented in the following section further illustrate this issue.
[64] See: Taking Stock, Volume 14.
[65] In 2017 the company built an efficient natural gas station to replace its coal-fired unit, resulting in significant reductions in emissions. See: Duke Energy, “Ashville Plant”.
[66] Taking Stock Online query.
[67] Aevitas, “Battery Recycling”.