2.4 Analysis of Off-site Transfers to Disposal, 2014–2018
2.4 Analysis of Off-site Transfers to Disposal, 2014–2018
2.4.3 Transfers to disposal in Canada
Transfers to disposal reported by Canadian facilities for the 2014–2018 period ranged from approximately 97 million kg to 109 million kg each year (Table 13). These transfers represent approximately 130 industrial sectors and 120 pollutants.
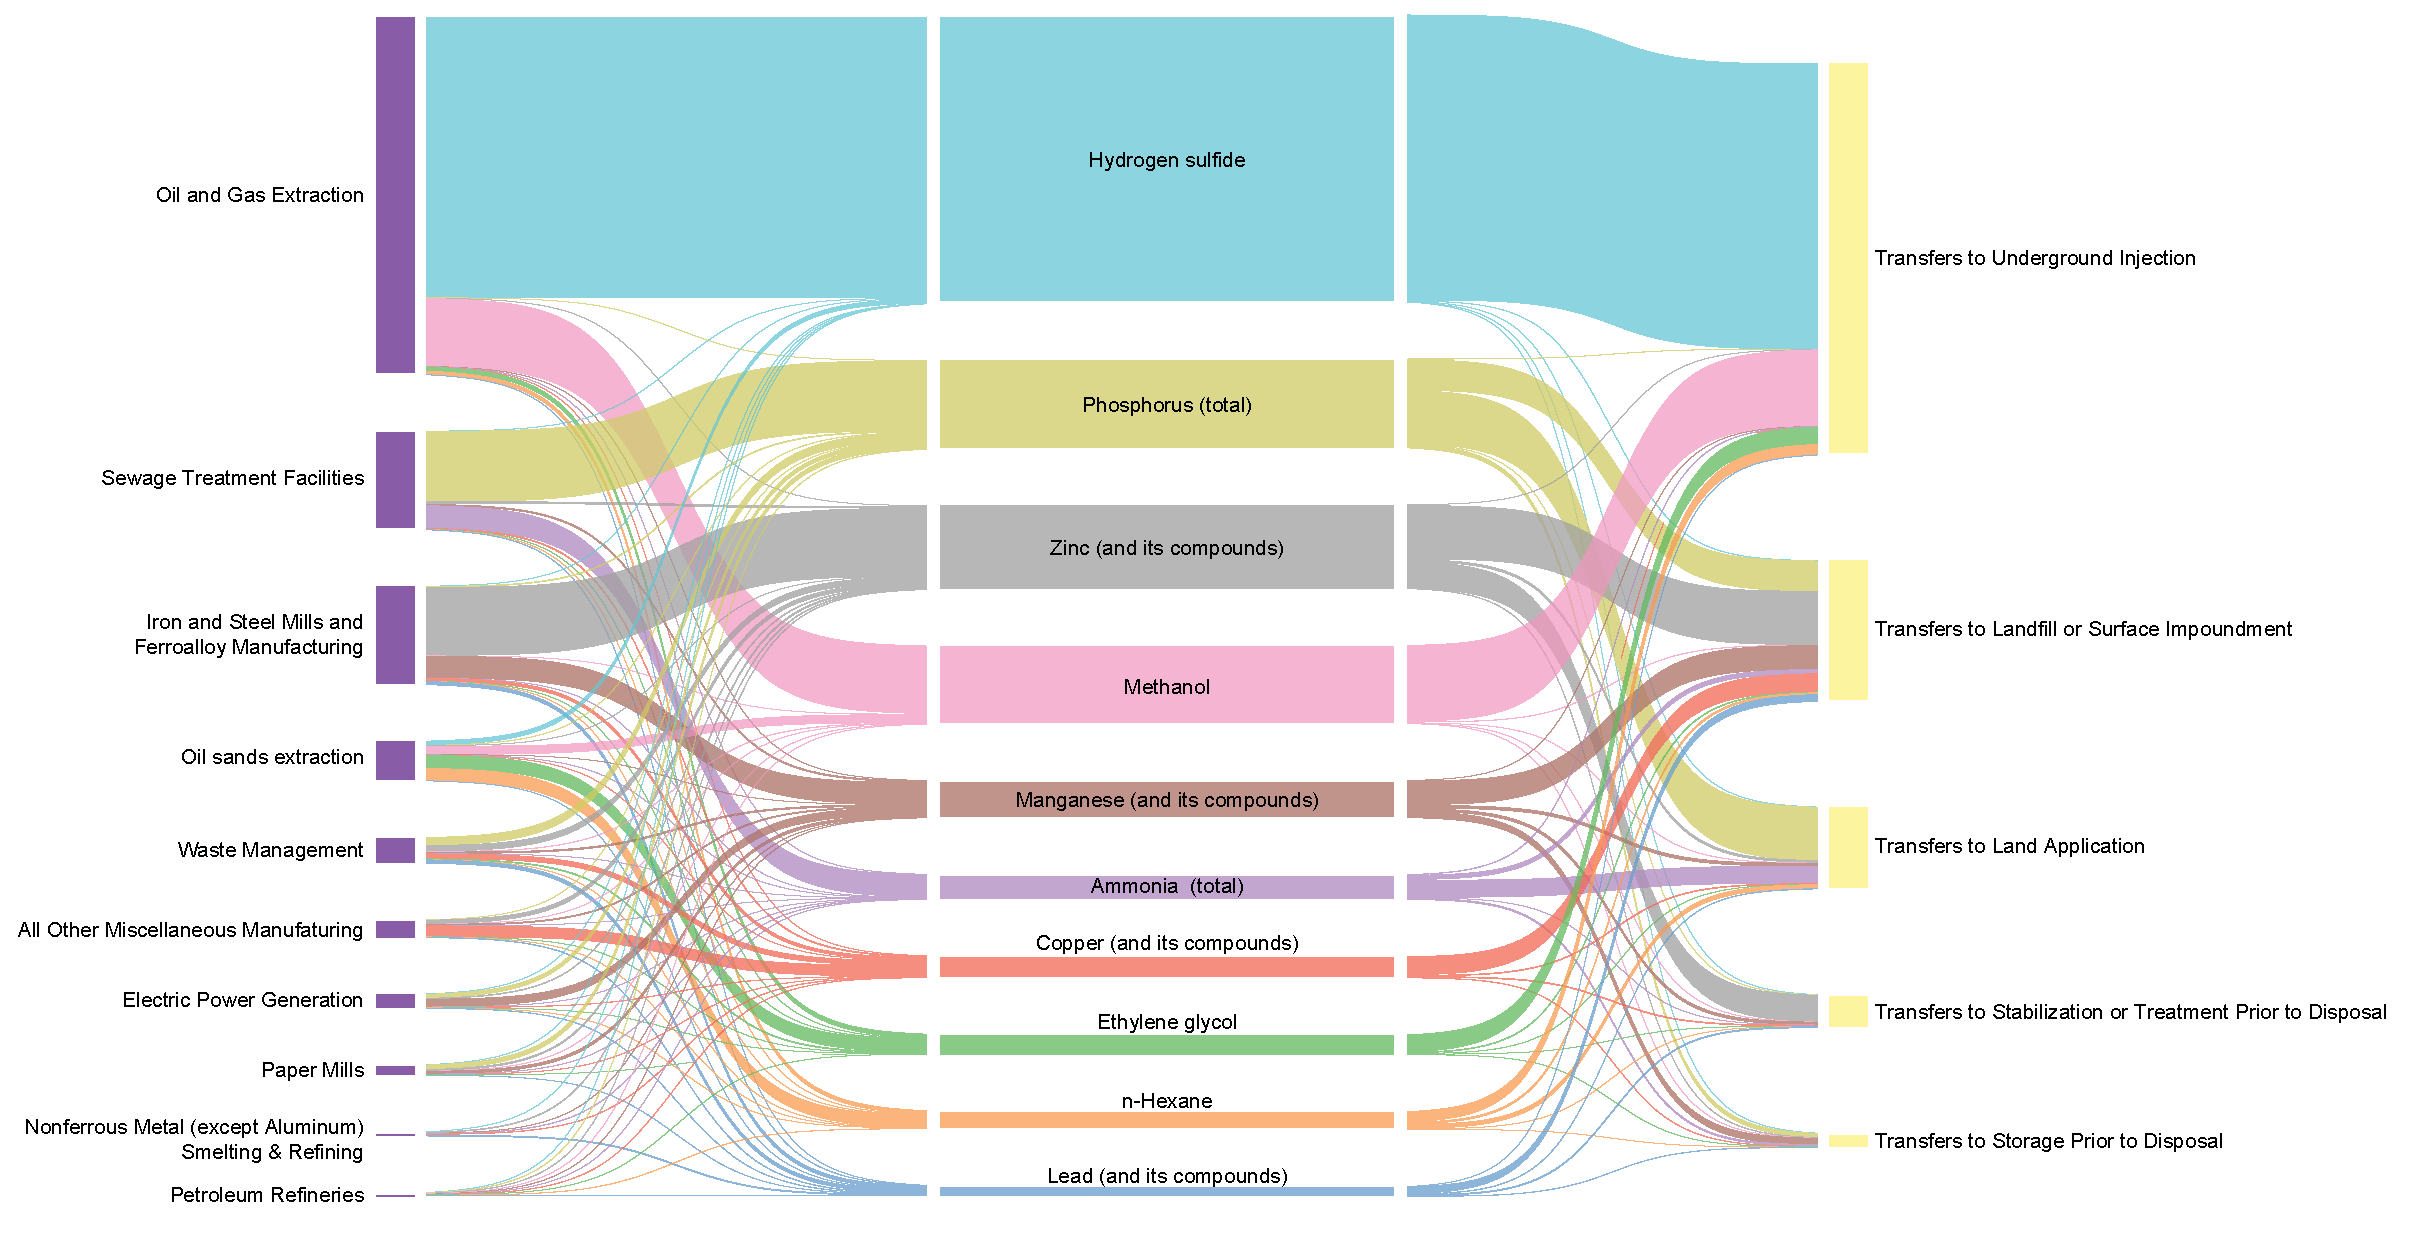
The Sankey diagram presented in Figure 16 shows that just four sectors accounted for 79% of the total in 2018: oil and gas extraction (including the non-conventional oil and gas extraction, or oil sands, sector)[55]; the iron and steel mills/ferroalloy manufacturing sector; the sewage treatment sector; and the waste management sector.
It also reveals that a small number of pollutants, such as hydrogen sulfide, total phosphorous, zinc compounds, and methanol, accounted for large proportions of the total; and that of all off-site disposal practices, transfers to underground injection dominated.
Figure 16. Transfers to Disposal in Canada by Sector, Pollutant, and Disposal Category, 2018
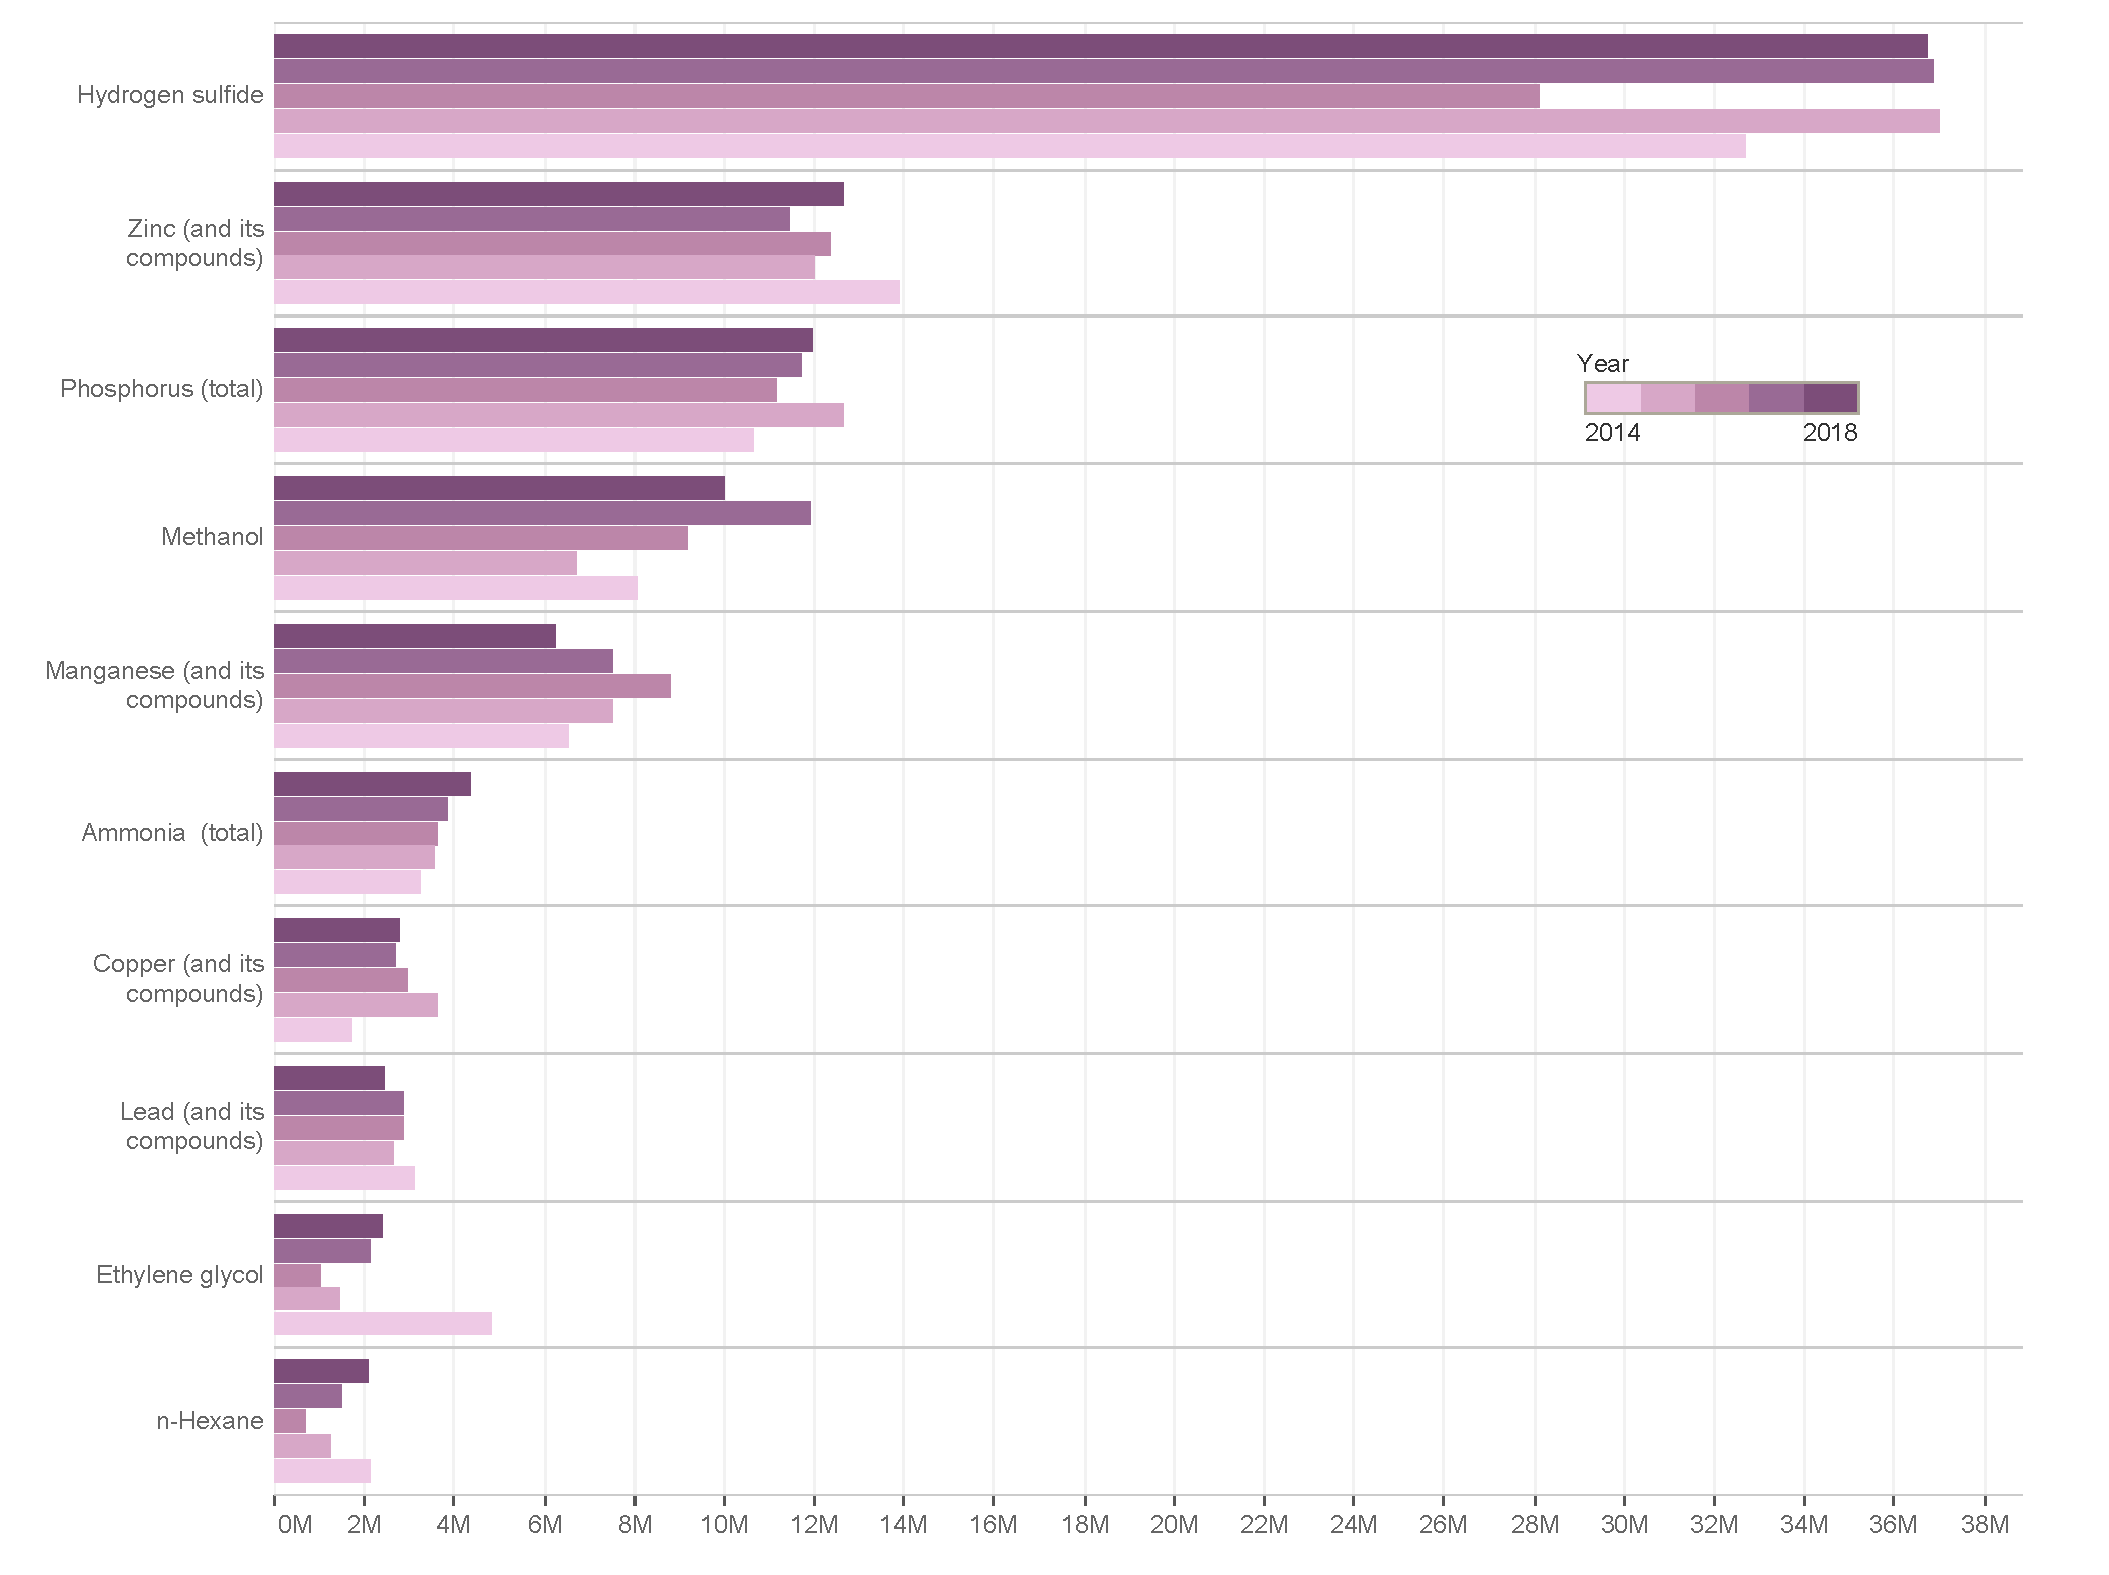
These top sectors and pollutants are also reflected in Figures 17a and 17b, respectively, which show how transfers to disposal in Canada changed between 2014 and 2018.
Figure 17a. Transfers to Disposal in Canada: Top Sectors, 2014–2018
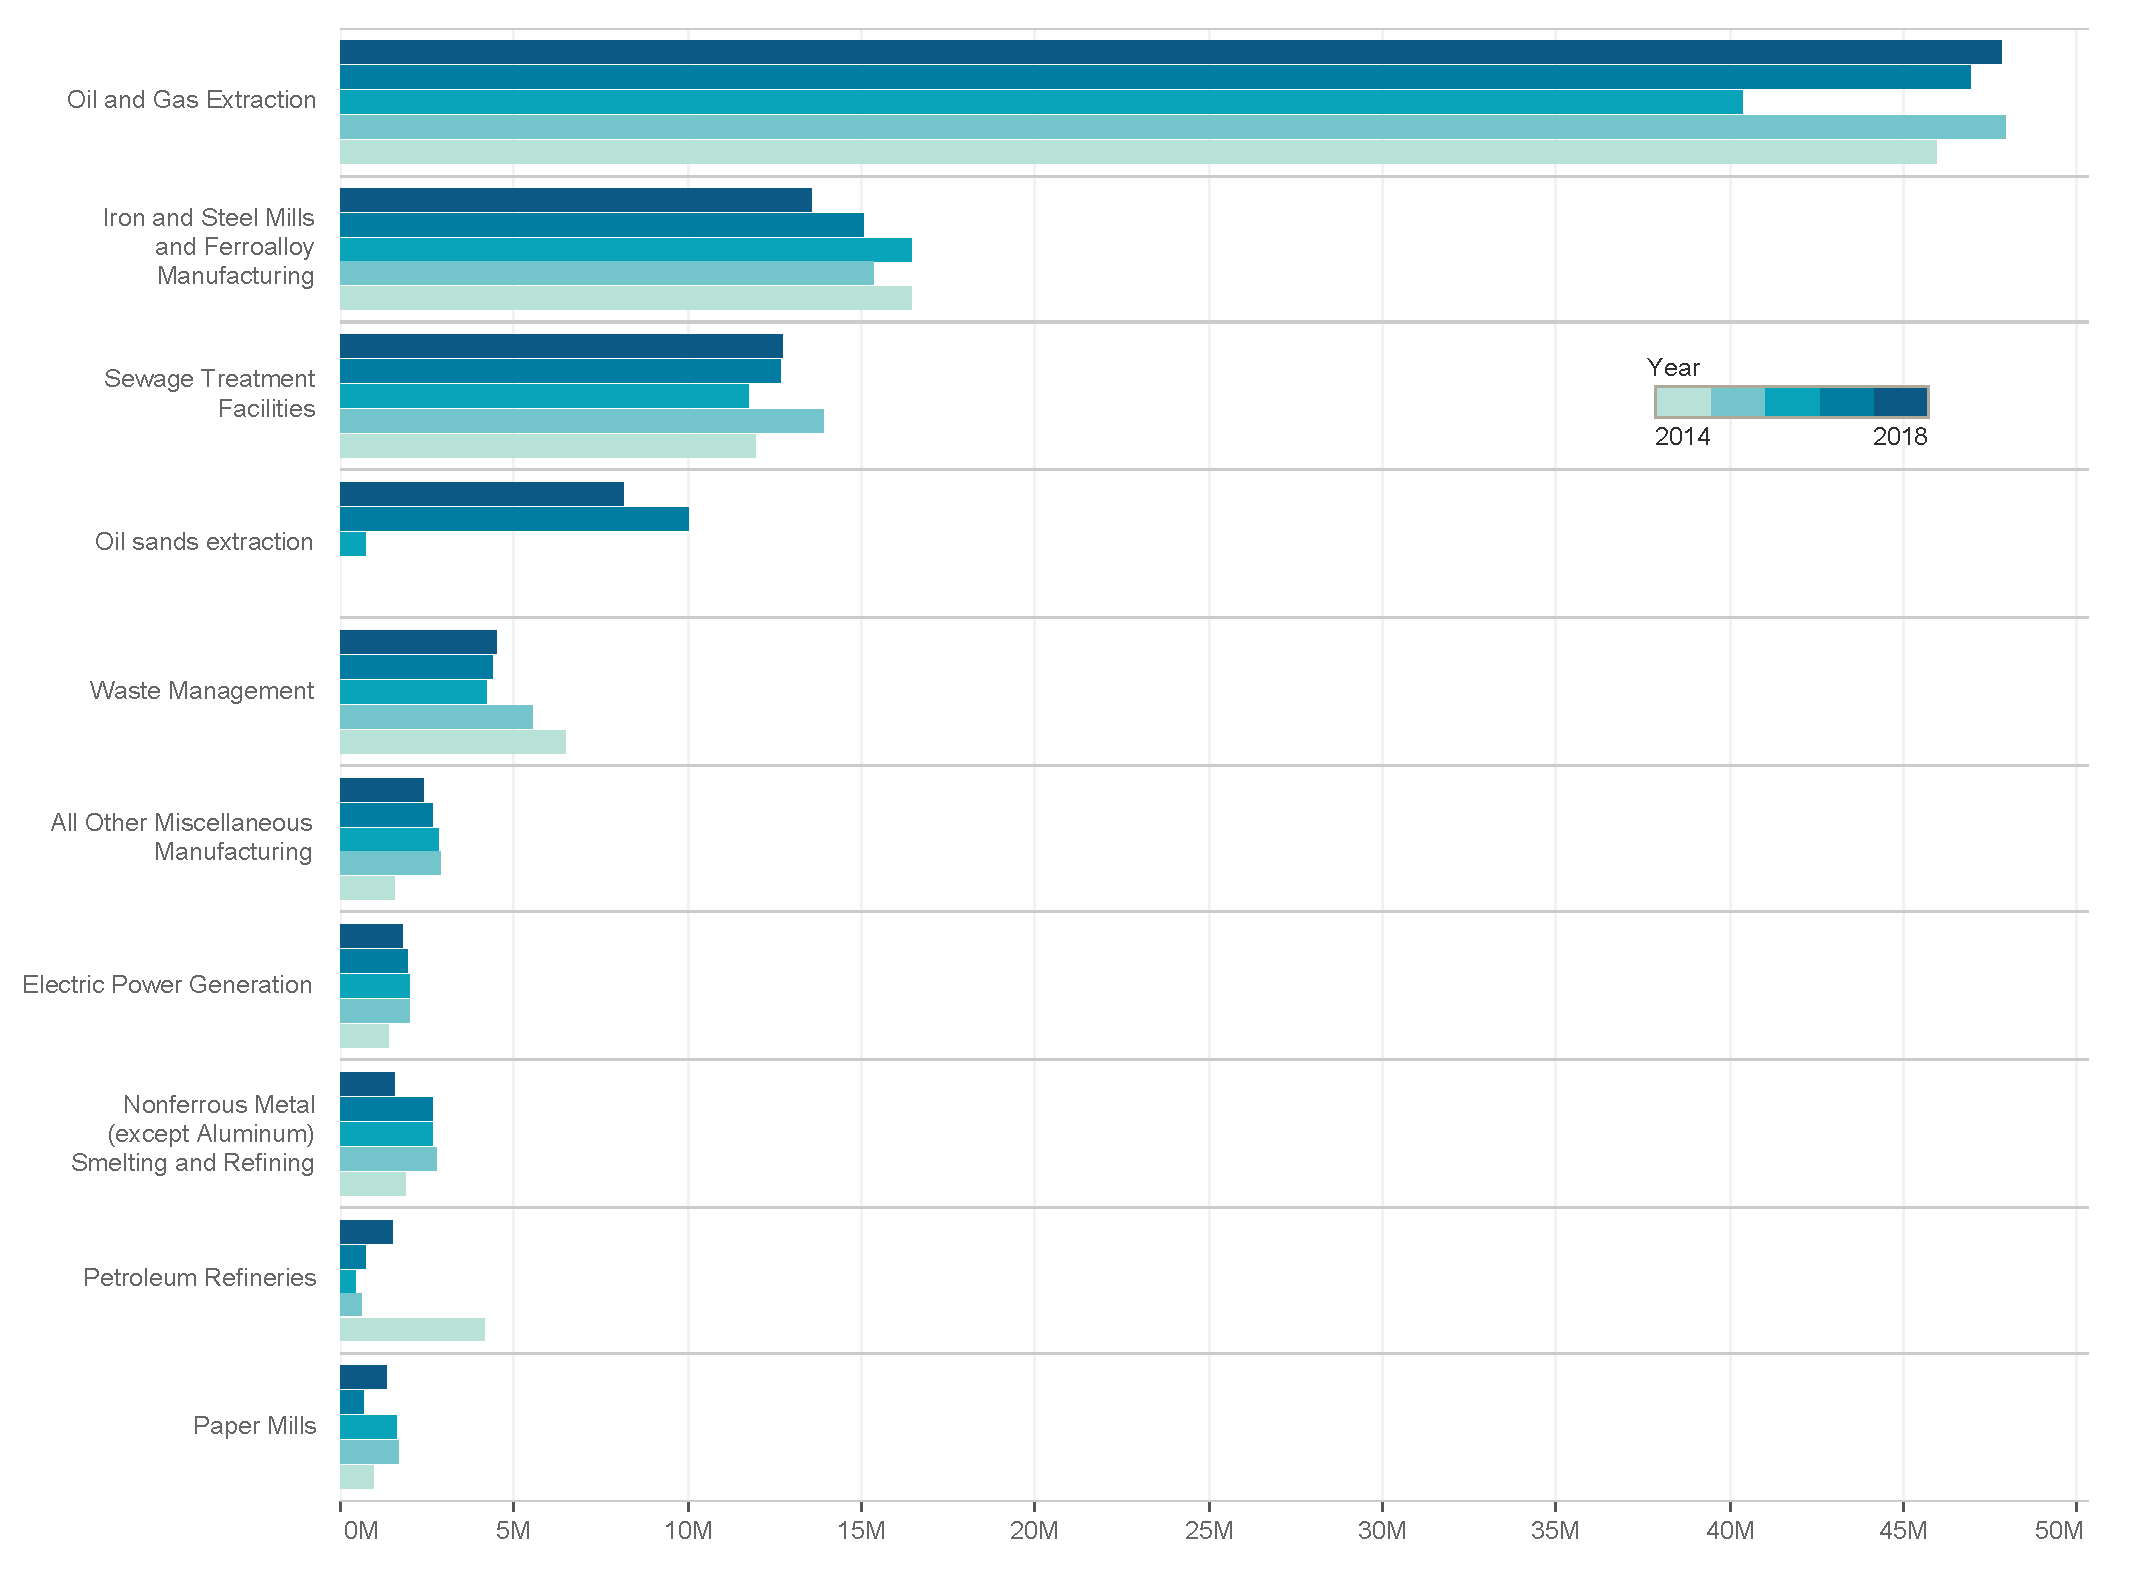
Figure 17b. Transfers to Disposal in Canada: Top Pollutants, 2014–2018
Transfers to underground injection in Canada were driven by the oil and gas extraction sector, which includes both conventional and non-conventional (oilsands) extraction activities (NAICS 21111 and 21114, respectively).[56] Between 150 and 200 facilities, mainly located in the provinces of Alberta, British Columbia, and Saskatchewan, reported from 39.7 to 53.1 million kg in such transfers each year (or 91-98% of total transfers to underground injection by all sectors). Notwithstanding these amounts, the facilities reporting the largest releases and transfers each year tended to dispose of their waste on site, either through underground injection or land disposal (Table 17).
Approximately 17% of these transfers can be attributed to oil sands facilities. Oil and gas production in Canada has increased by more than 75% since 2000, primarily due to a 300% increase in oil sands production in Alberta. Production from this sector is expected to rise from around 2.5 million barrels per day in 2016 to nearly 4 million in 2026.[57]
Table 17. Transfers to Underground Injection by the Canadian Oil and Gas Extraction Sector (NAICS 21111/4); and Main Disposal Practices of Top Facilities, 2014–2018
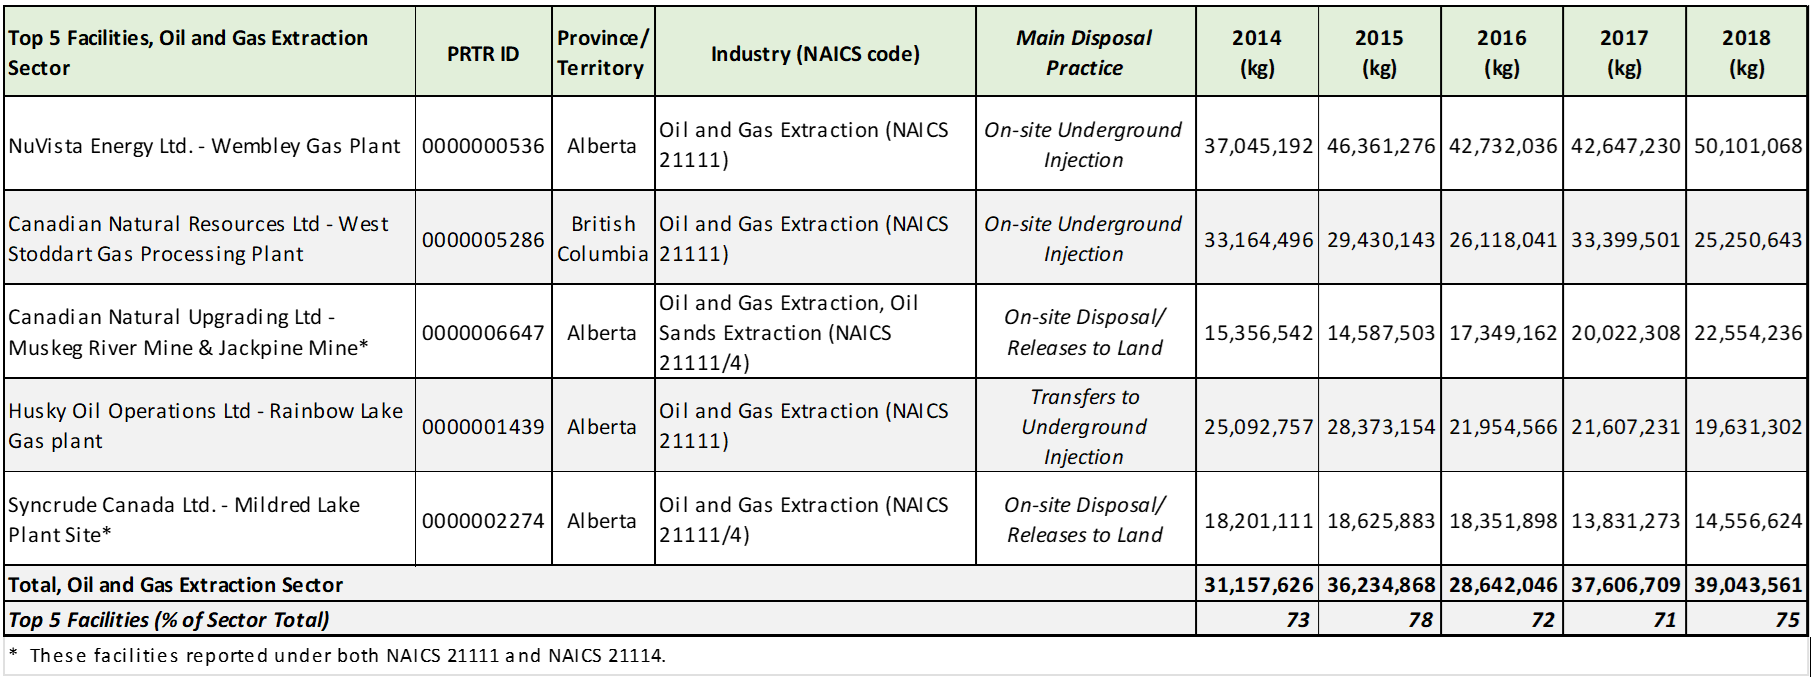
Among the substances reported in largest proportions by this sector are hydrogen sulfide (about 70% of the annual totals), methanol (about 20%), and other substances such as ethylene glycol and n-hexane. Hydrogen sulfide occurs naturally in crude oil and because of its corrosive nature, it must be removed—after which companies typically inject it underground as an alternative to flaring, a practice that is discouraged because of the resulting toxic air emissions.
As mentioned in chapter 1, the oil and gas extraction sector is not subject to the US TRI, while in Mexico the sector is subject to the RETC, but not all facilities report. For example, of the 149 Mexican facilities in this sector included in the Taking Stock Online database, only about 20% have reported each year.
Table 18 shows that three Canadian sectors (of approximately 115) accounted for just over half of all transfers to landfills or surface impoundments each year.
Table 18. Top Three Sectors for Transfers to Landfills/Surface Impoundments, Canada, 2014–2018
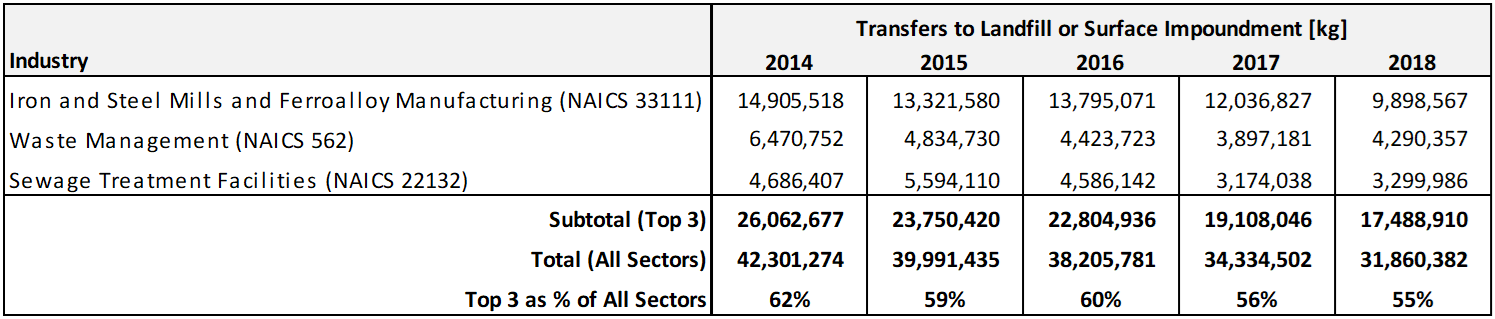
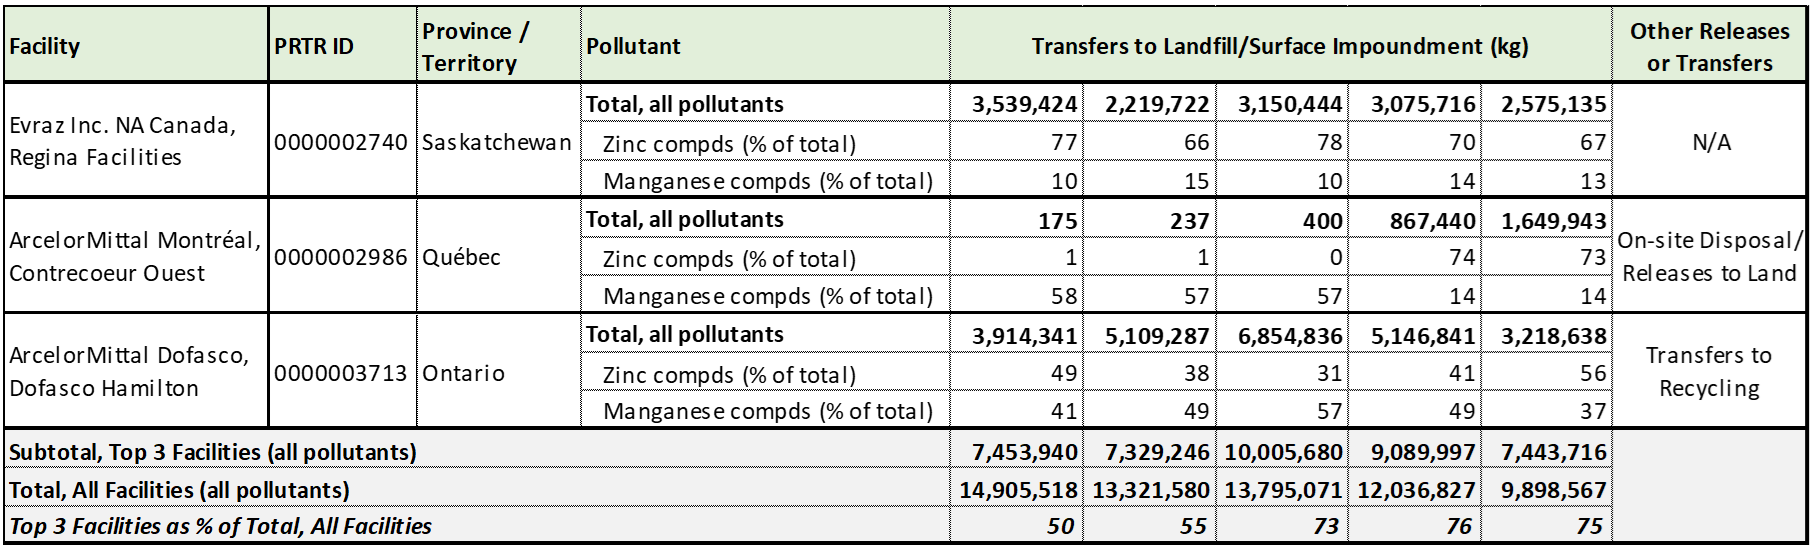
Of a total of 20 facilities in the iron and steel mills/ferroalloy manufacturing sector (NAICS 33111), ten located in the provinces of Ontario, Québec, Saskatchewan, and Alberta reported transfers to landfills/surface impoundments during this period, with zinc and manganese compounds together accounting for large proportions of these annual transfers (Table 19). Manganese, an important substance for this sector, is used to remove oxygen and sulfur during the production of iron and is also an essential alloy that helps convert iron to steel (USGS, 2014). About three-quarters of the zinc used in the industry serves as a coating to protect iron and steel from corrosion and as an alloy to make bronze and brass, etc. (USGS 2021).
About 40% of the facilities in this sector also recycled portions of their zinc and manganese waste. It would be interesting to understand the factors that influence facilities’ management of these wastes—for example, if it is due to the quality of the waste generated (including the degree to which they can be recycled), the availability of recycling facilities, or other factors.
Table 19. Transfers to Landfill/Surface Impoundments by the Canadian Iron and Steel Mills/ Ferroalloy Manufacturing Sector (NAICS 33111), 2014–2018
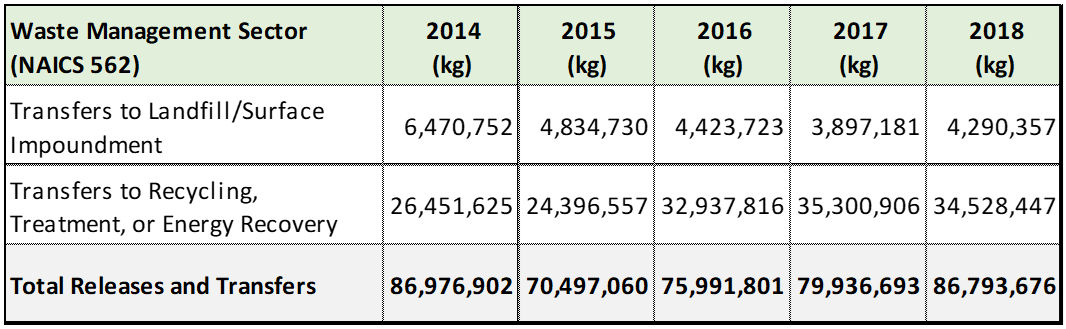
Transfers to disposal by the waste management sector (NAICS 562), which ranked second in Canada, declined between 2014 and 2018, with a corresponding increase in transfers to recycling, treatment, or energy recovery (Table 20).
Table 20. Transfers to Landfill/Surface Impoundments by the Canadian Waste Management Sector (NAICS 562), 2014–2018
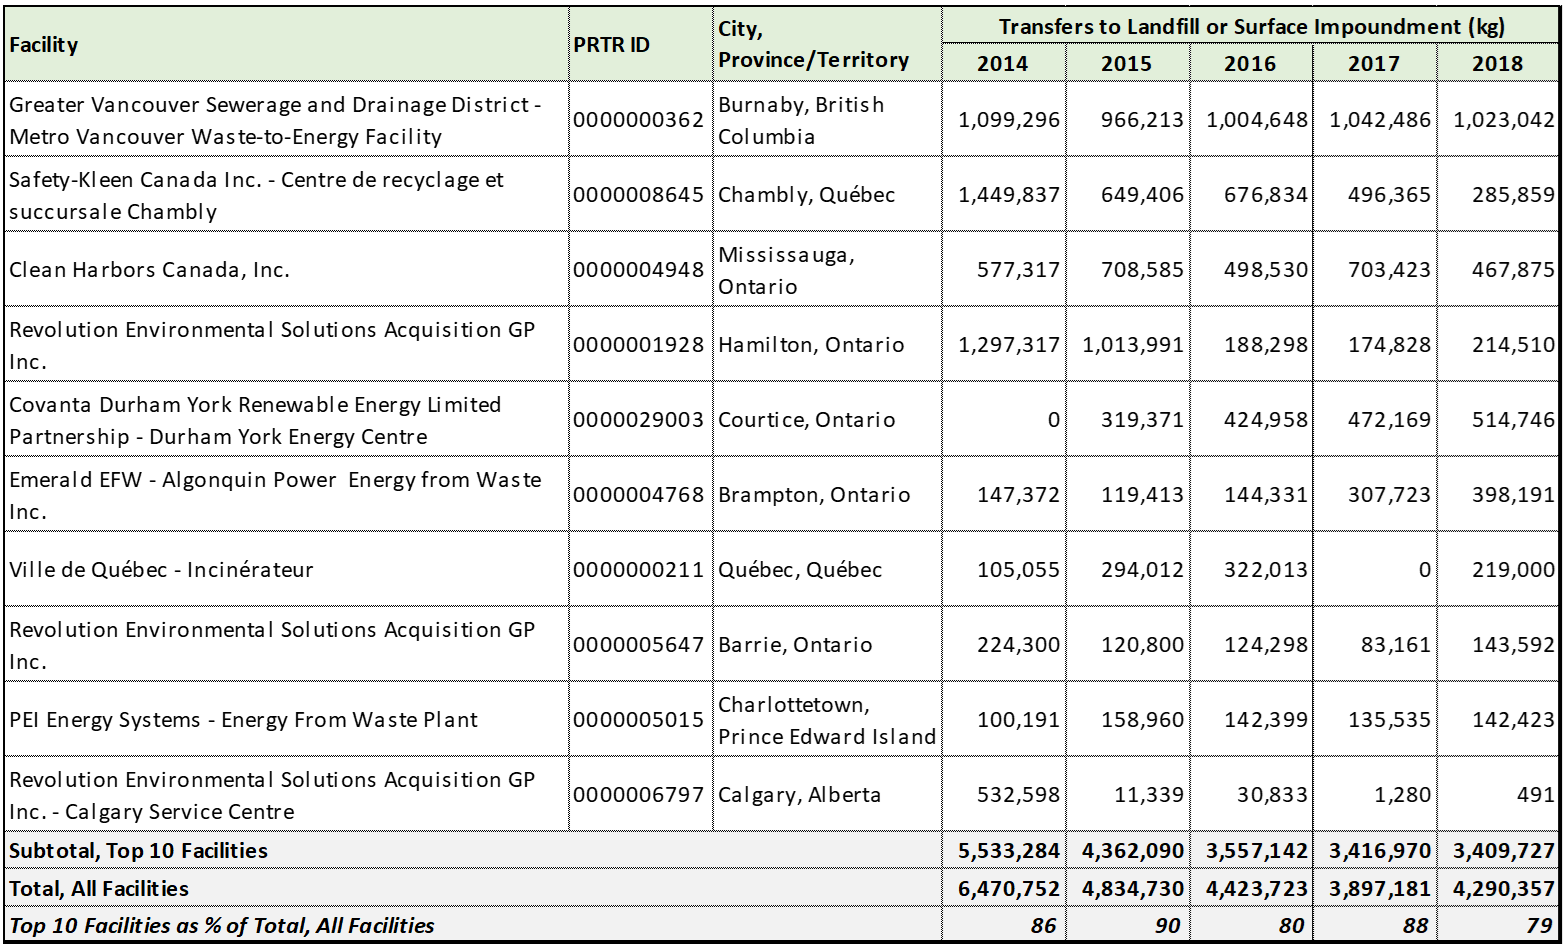
Together, ten waste management facilities accounted for most of the annual transfers to landfills/surface impoundments by this sector (Table 21). They reported total phosphorous, zinc, copper, lead, manganese, and other metal compounds, as well as tetrachloroethylene, ethylene glycol, methanol, and many other pollutants. This sector handles waste generated by a variety of industrial activities, some of which requires specialized handling or treatment. Since the capabilities of the facilities in this sector vary widely, they often serve as intermediaries, transferring some of the waste they receive to other facilities—even those located across national borders. Consequently, the ability to track the final disposition of these pollutants can be very difficult. This issue is discussed later in this section.
Table 21. Transfers to Landfill/Surface Impoundments by the Top Facilities in the Canadian Waste Management Sector (NAICS 562), 2014–2018
The sewage treatment sector (NAICS 22132) ranked third for transfers to disposal in Canada, primarily sending contaminants (in the form of biosolids) to land application. Three pollutants—total phosphorus, nitric acid/nitrate compounds, and ammonia—accounted for about 99% of all releases and transfers by this sector, with total phosphorus and ammonia also the top pollutants transferred to land application.
Table 22, which presents the transfers to land application by the top five sewage treatment plants, shows that the increase in these transfers was driven by Toronto’s Ashbridges Bay treatment plant. Prior to 2017, this facility transferred its waste to landfills or surface impoundments, including to a site located in the United States.
Table 22. Transfers to Land Application by the Canadian Sewage Treatment Sector (NAICS 22132), 2014–2018
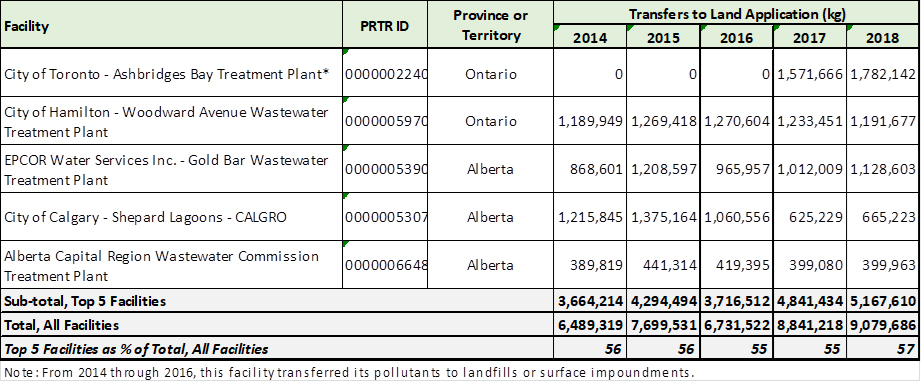
In addition to total phosphorus and ammonia, these facilities reported transfers of metal compounds such as copper, lead, manganese, zinc, selenium, cadmium, and mercury, along with many other pollutants. Of more than 150 sewage treatment plants reporting during this period, those located in the cities of Toronto, Calgary, Montreal, and Vancouver account for about one-third of total releases and transfers by this sector—which is to be expected given that these are the most populous cities in Canada, with residential, commercial, and industrial sources generating significant amounts of wastewater to be treated. Taking Stock, Volume 13 provides insights into the complexity of the wastewater treatment needs in North America and the wide variety of technologies that can be required to treat the myriad of existing, as well as emerging, pollutants in wastewater.
As mentioned in chapter 1, municipal and other publicly owned facilities in this sector (known as publicly owned treatment works, or POTWs) are not subject to reporting in the United States. In Mexico, the wastewater treatment sector is not subject to the RETC because it is under municipal jurisdiction (although any Mexican facility that discharges wastewater into national water bodies must report these releases).
Two other sectors contributed to the increase in transfers to land application during this period:
- the non-conventional oil and gas (or oilsands) extraction sector (NAICS 21114), which reported approximately 700,000 kg in transfers to land application in 2017 and 2.2 million kg in 2018 (of toluene, n-hexane, xylenes, and benzene); and
- paper mills (NAICS 32212), which reported almost 600,000 kg in 2014 and more than 1 million kg in 2018 of total phosphorous, aluminum fume (or dust), and manganese, zinc, and lead compounds.
Table 23 presents the data for transfers to stabilization (or treatment) prior to disposal, as well as transfers to storage prior to disposal—two categories that represented relatively small proportions of total transfers to disposal in Canada during this period.
Table 23. Transfers to Stabilization/Treatment prior to Disposal; and to Storage prior to Disposal in Canada, 2014–2018
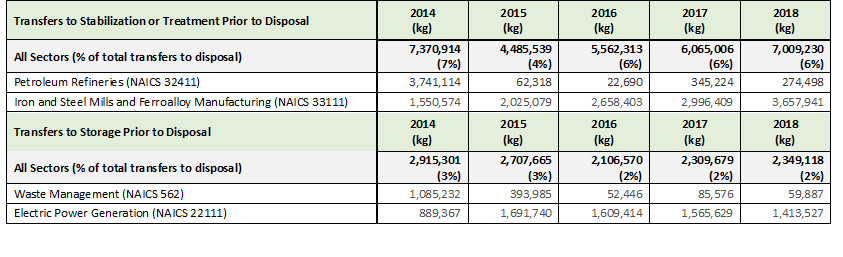
The data show that petroleum refineries (NAICS 32411), together with the iron and steel mills/ferroalloy manufacturing sector (NAICS 33111), accounted for a large proportion of total transfers to stabilization or treatment prior to disposal. The decrease for the petroleum refining sector during this period appears to correspond to a decrease in total releases and transfers, particularly for aluminum fume or dust, by the North Atlantic Refinery located in Come by Chance, Newfoundland.[58] Meanwhile, the increase for the iron and steel mills/ferroalloy manufacturing sector was driven by the Ivaco Rolling Mills (Ontario) facility, which more than doubled its transfers of zinc compounds.
The top sectors for transfers to storage prior to disposal were the waste management (NAICS 562) and the electric power generation (NAICS 22111) sectors. The decrease in transfers to storage prior to disposal for the waste management sector appears to correspond to an increase in the sector’s transfers of toluene, xylenes, methyl ethyl ketone, and other pollutants to recycling, treatment, or energy recovery. Meanwhile, the increase during this period for electric utilities can be attributed mainly to the larger transfers to storage of manganese compounds and total phosphorous reported by the Capital Power – Genesee Thermal Generating Station in Alberta.
[55] The non-conventional oil and gas, or oil sands, extraction sector is shown separately from the conventional oil and gas extraction sector in this figure; however, the two sectors are discussed together in this report.
[56] Starting with the 2017 reporting year, oilsands extraction activities in Canada were further disaggregated into in-situ oilsands extraction (NAICS 211141) and mined oilsands extraction (NAICS 211142).
[57] CEC. 2020. Alberta Tailings Ponds II. Factual Record regarding Submission SEM-17-001.
[58] According to the NPRI program, the large amounts of aluminum (fume/dust) initially reported by this facility are likely a reporting error.