2 Feature Analysis: Off-site Transfers to Disposal in North America, 2014–2018
2.4 Analysis of Off-site Transfers to Disposal, 2014–2018
2.4.2 North American transfers to disposal: Top pollutants and sectors, 2014–2018
Figure 14 presents a Sankey diagram of the top pollutants and industry sectors represented in North American transfers to disposal for 2018. The sectors and pollutants are shown in descending order by volume and disposal category.
Figure 14. North American Transfers to Disposal by Sector, Pollutant, and Disposal Category, 2018
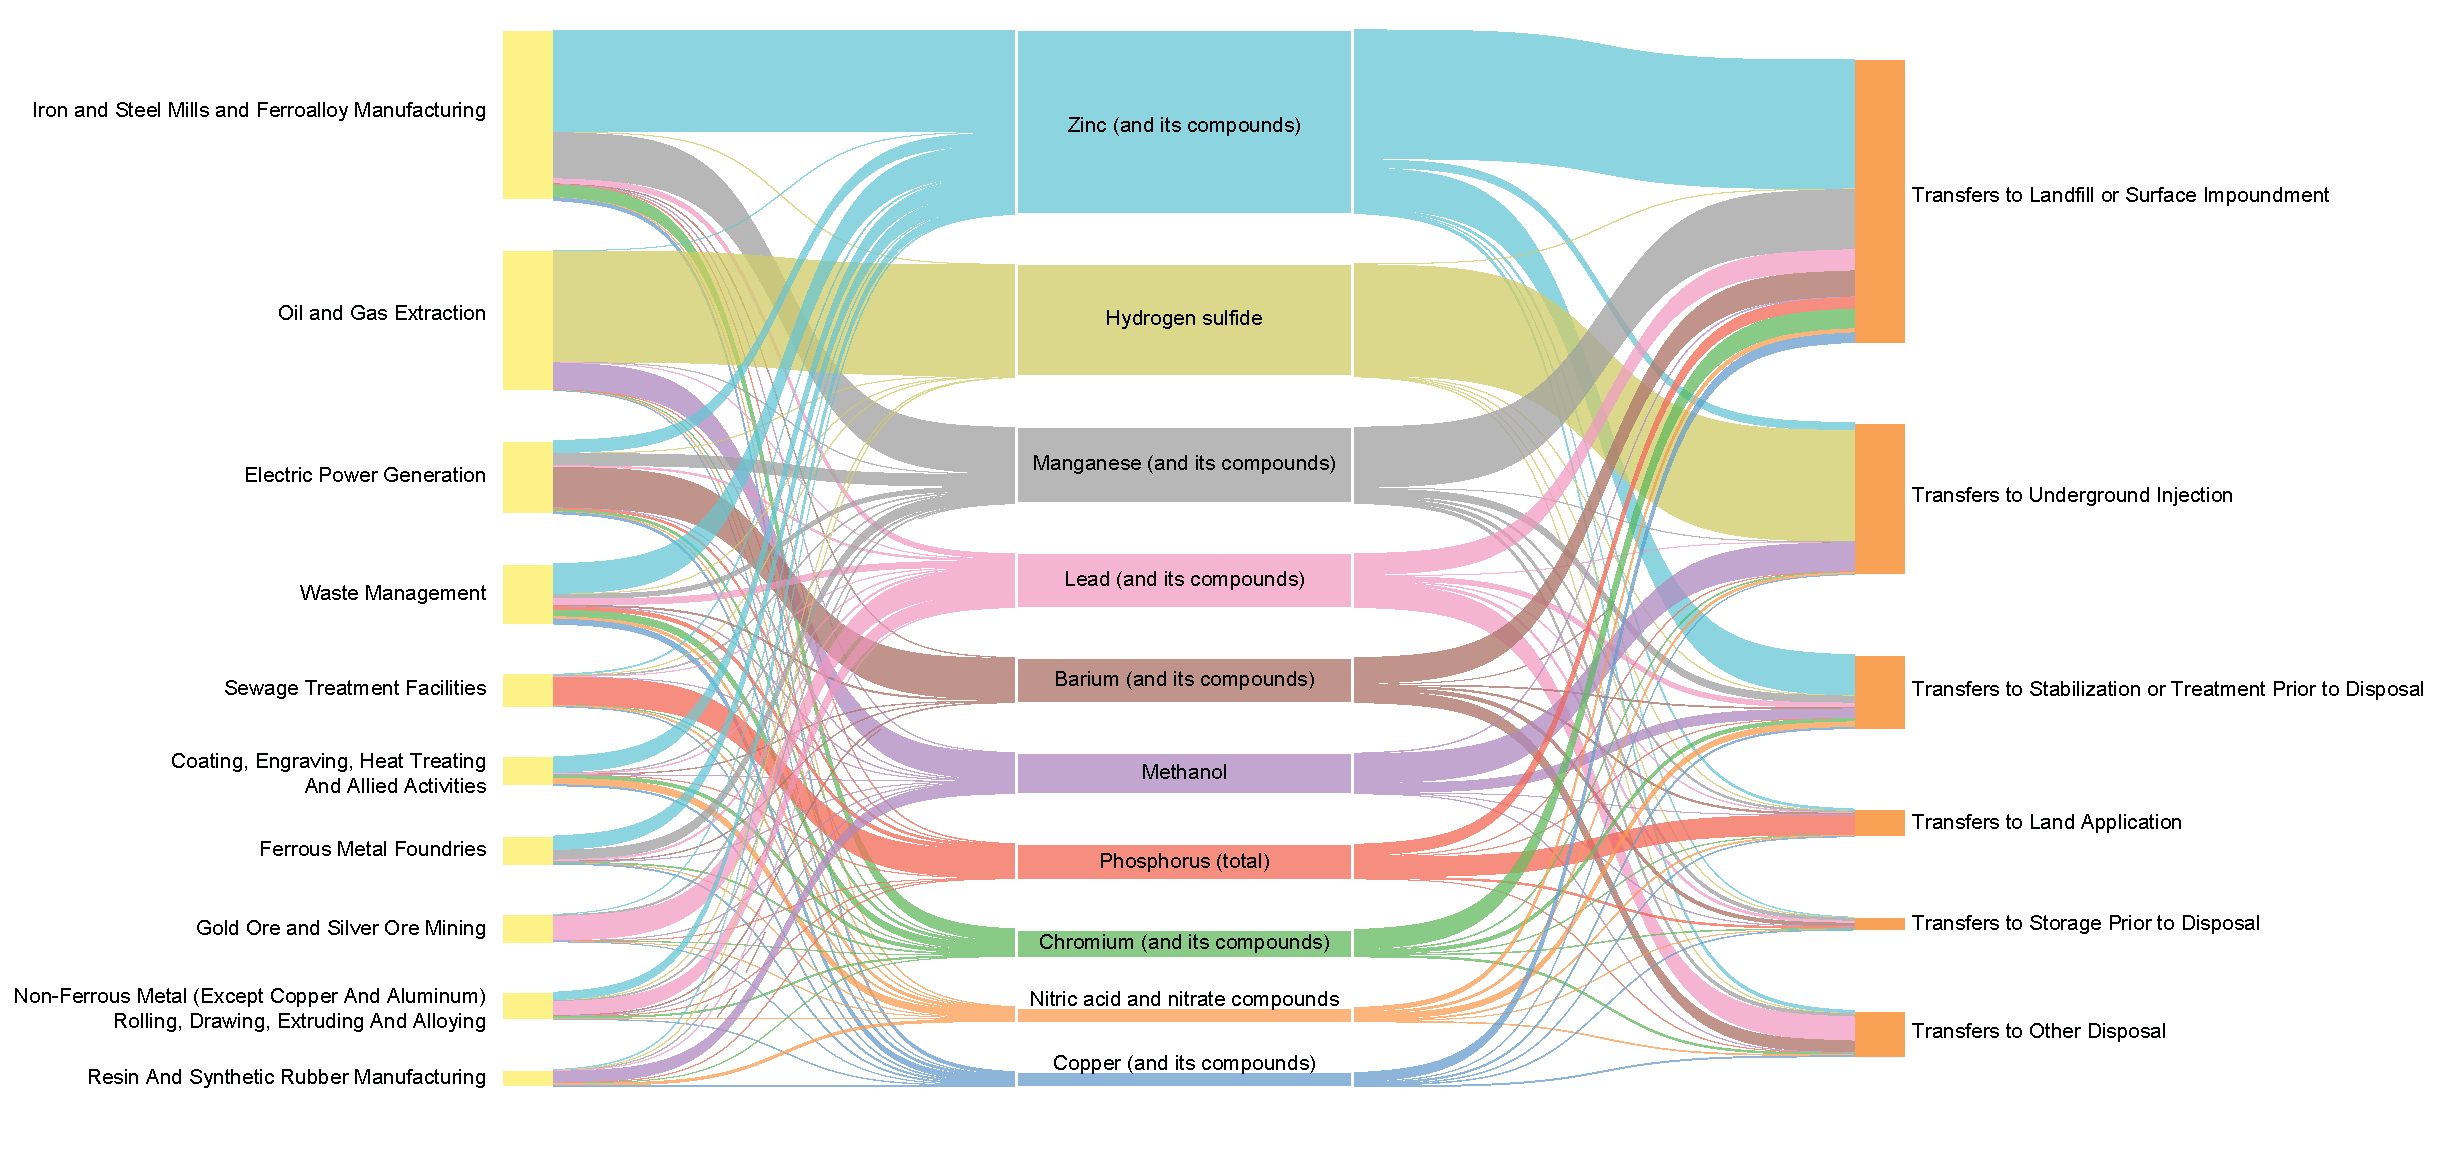
This figure reveals that ten sectors accounted for two-thirds of total transfers to disposal that year. Among them are the iron and steel mills/ferroalloy manufacturing sector; oil and gas extraction sector; and the electricity generation, waste management, and sewage treatment sectors.[53]
Similarly, the top ten pollutants (or pollutant groups) accounted for 78%, or more than 261 million kg, of total transfers to disposal that year.
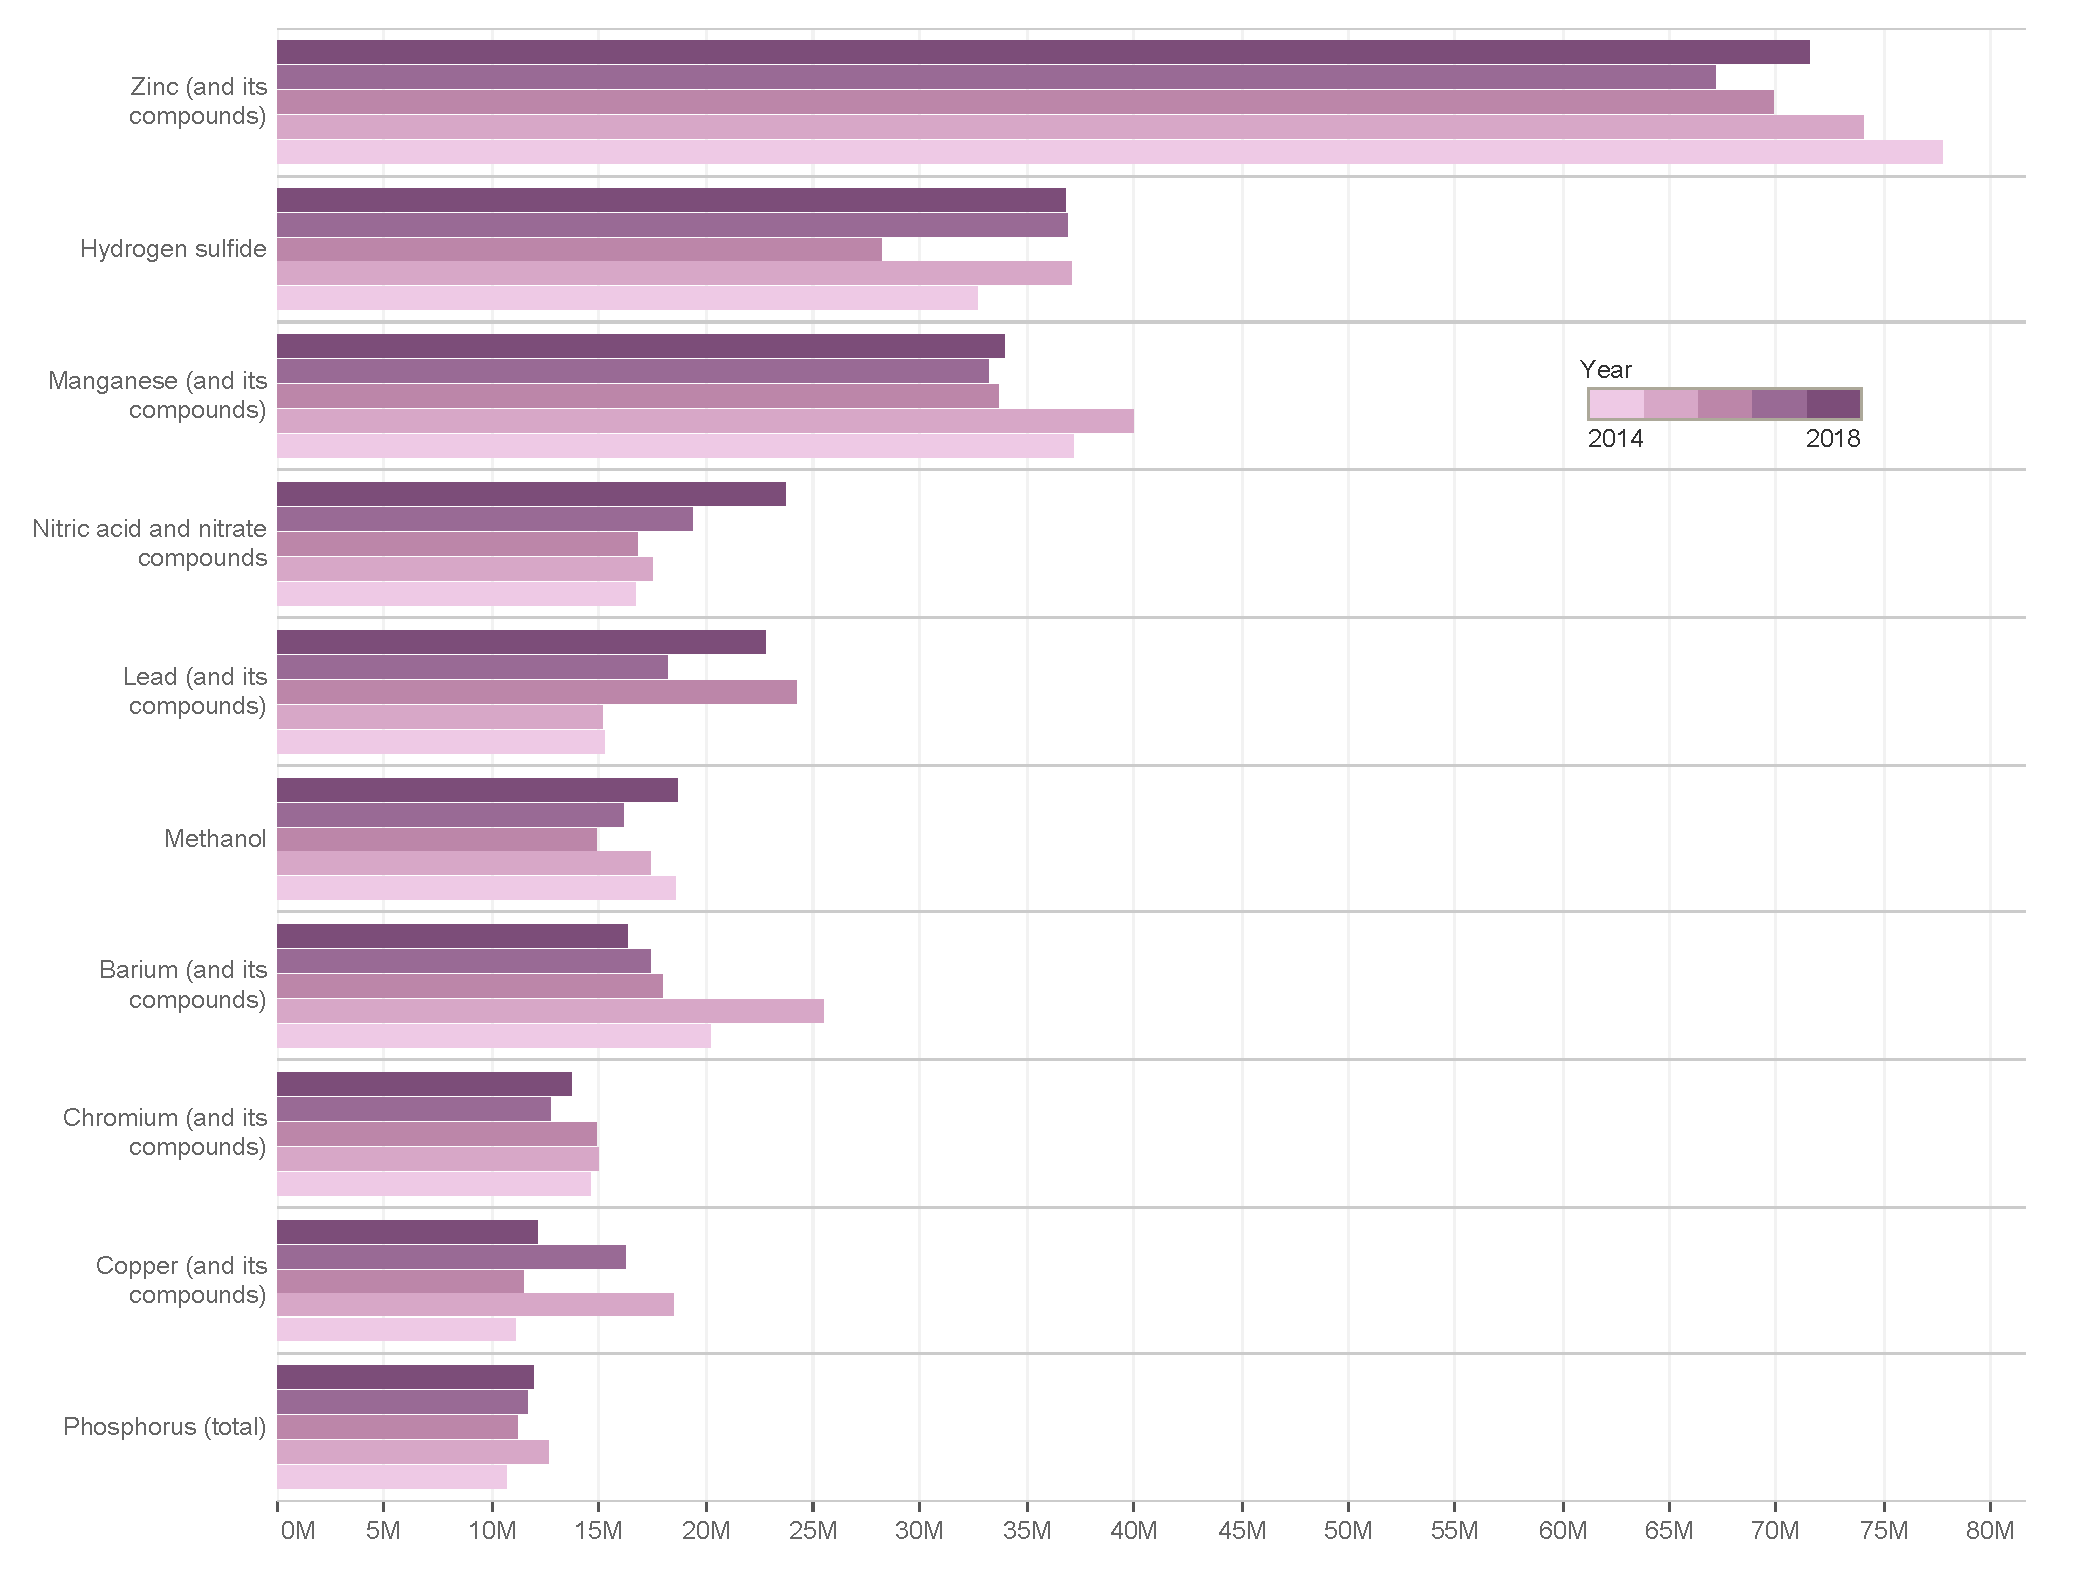
The information in the Sankey diagram is reflected in Figures 15a and 15b, below, which show how transfers to disposal in the region changed between 2014 and 2018.
Figure 15a. North American Transfers to Disposal: Top Sectors, 2014–2018
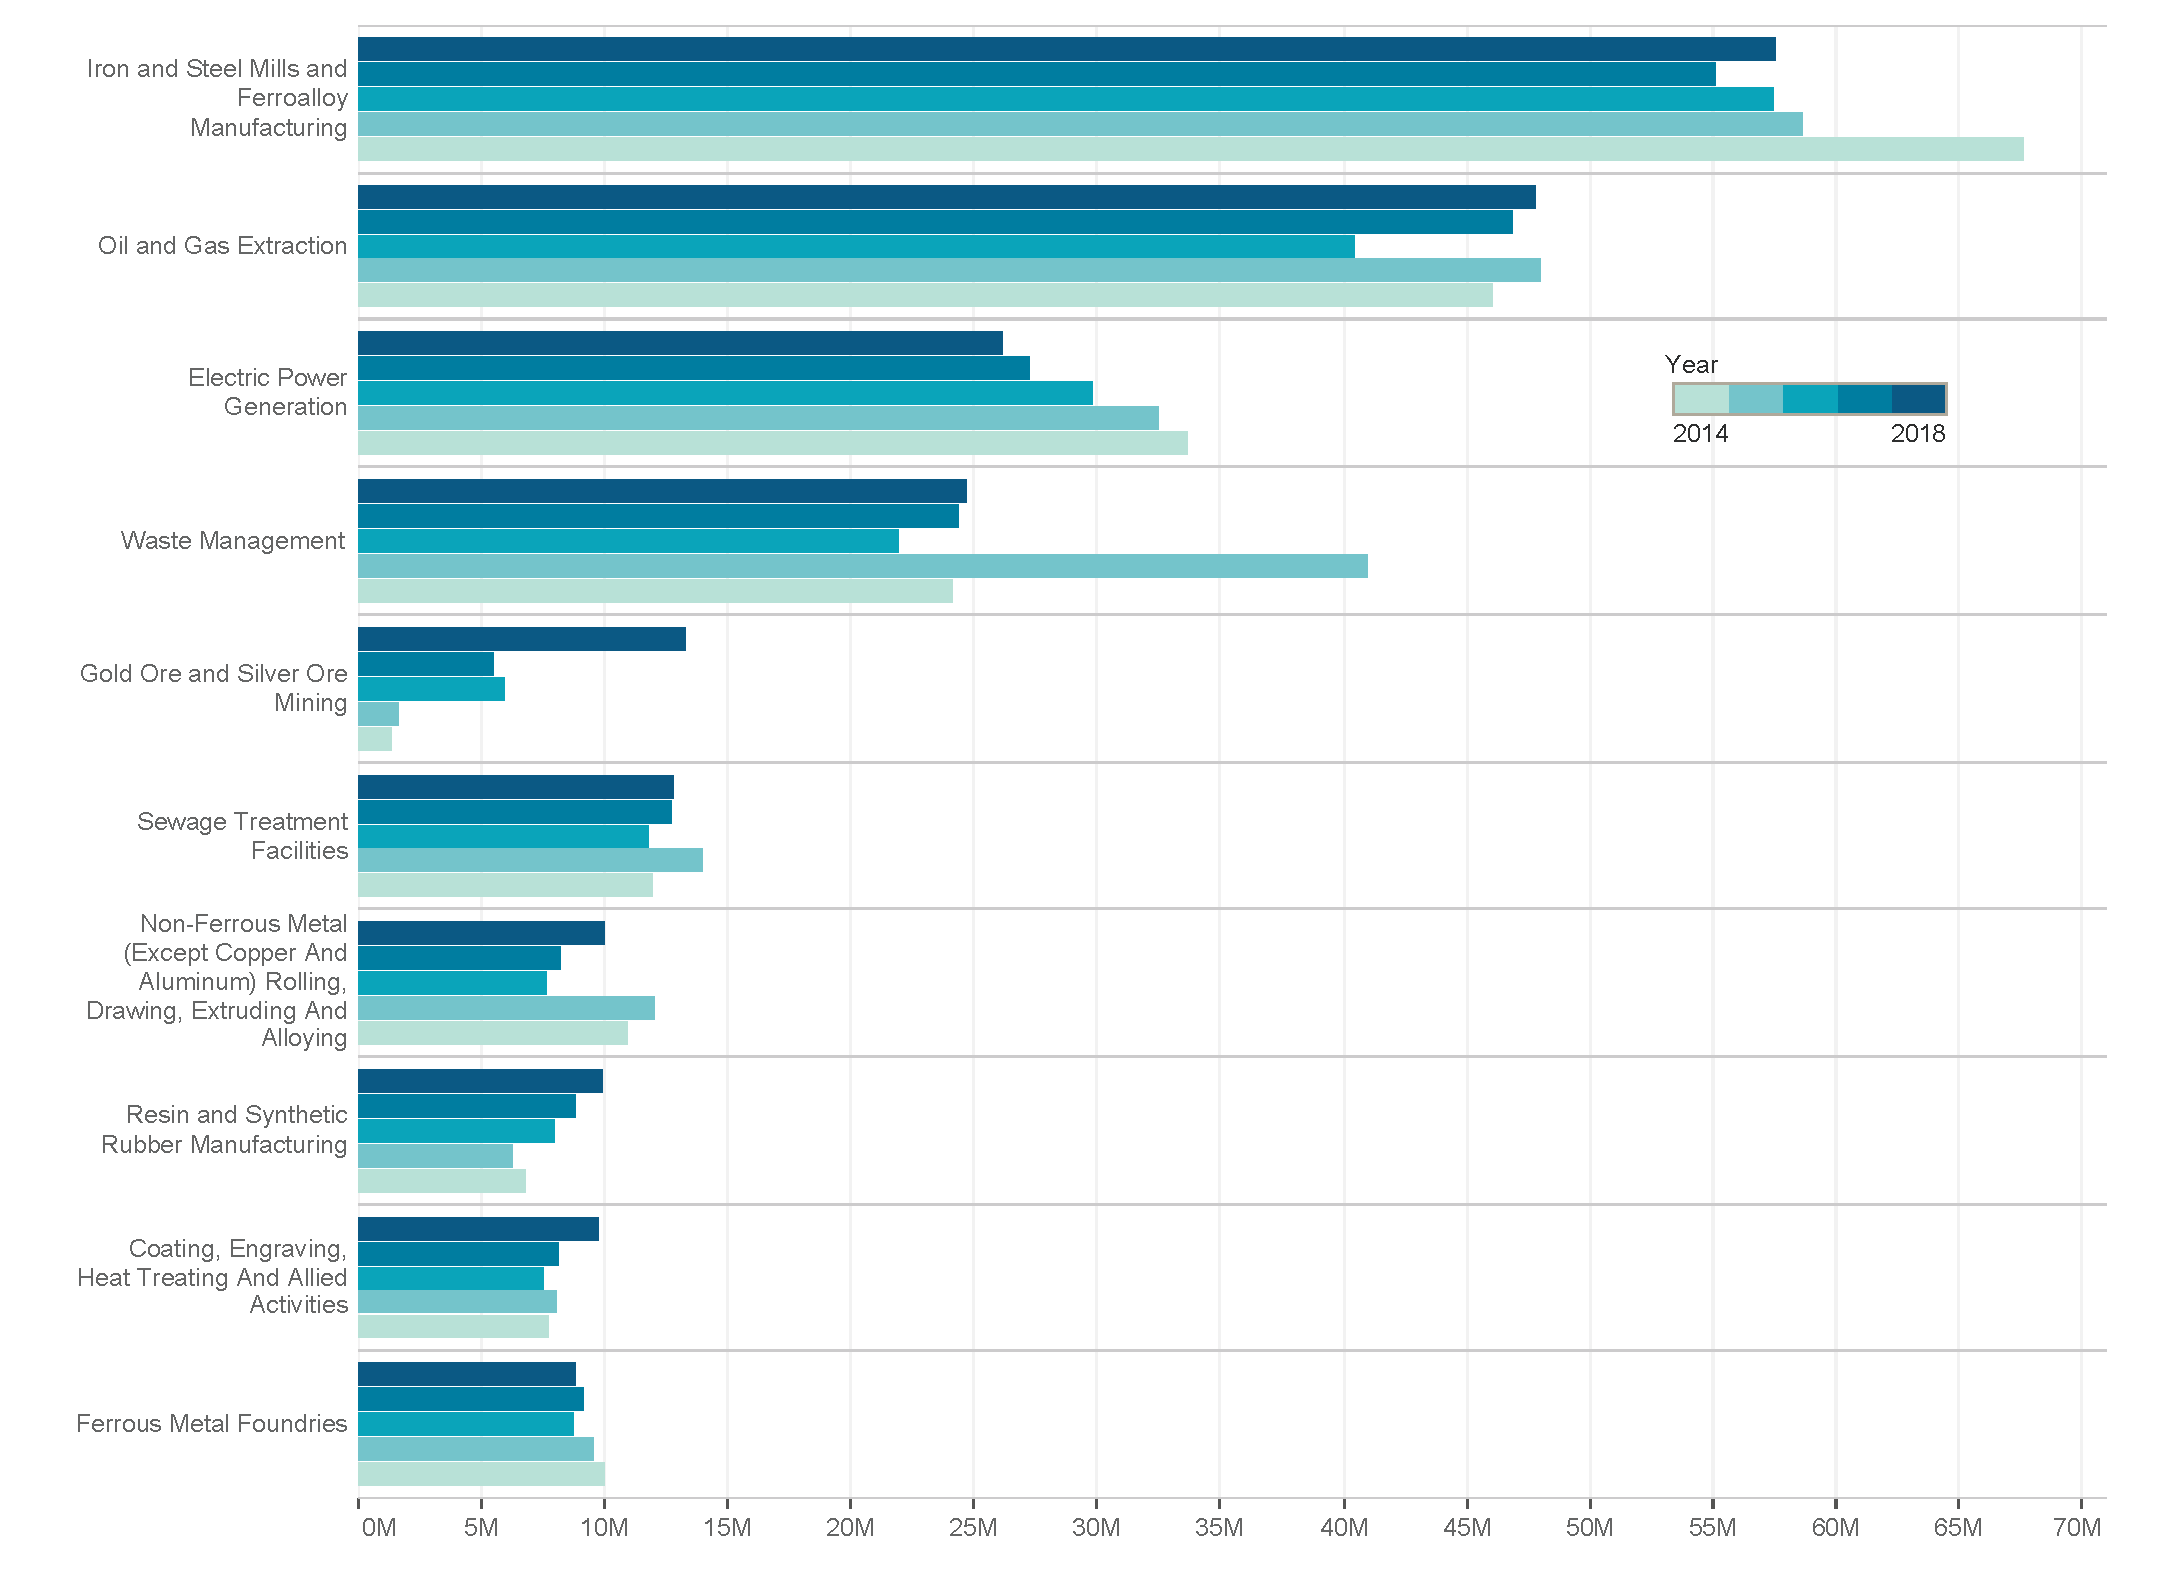
Figure 15b. North American Transfers to Disposal: Top Pollutants, 2014–2018
Between 2014 and 2018, 429 of the 538 pollutants (or pollutant groups) reported overall by North American facilities were transferred to disposal.[54] Table 15 reveals that of the three countries, facilities in the United States reported the most pollutants in each disposal category, except land application (where Canadian facilities reported the largest number of substances).
Table 15.Number of Reported Substances by Disposal Category, North America, 2014–2018
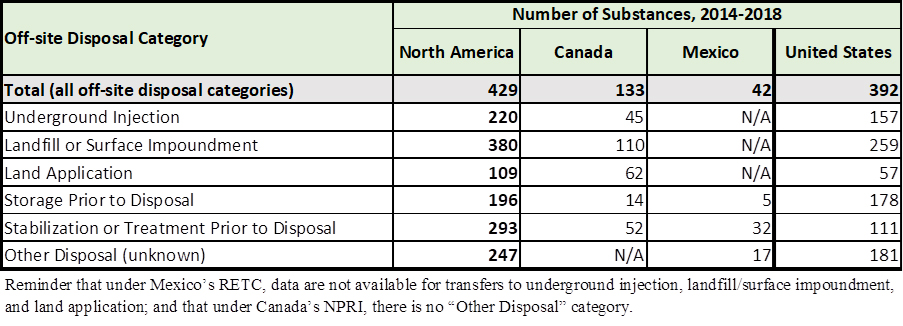
Note: Readers are reminded that under Mexico’s RETC, data are not available for transfers to underground injection, landfill/surface impoundment, and land application; and that under Canada’s NPRI, there is no “Other Disposal” category. Differences among national reporting requirements need to be considered when interpreting North American PRTR data.
In addition to reflecting the industrial profile of each country, these data reflect the fact that more substances are subject to reporting under the US TRI than the other two programs. As mentioned in chapter 1, because of the differences among the three PRTRs in the substances subject to reporting, only 70 of the more than 500 pollutants reported throughout the region are common to all three programs.
The impacts of these differences in reporting requirements are shown in Table 16, which presents the 2018 data for transfers to disposal of pollutants that are unique to either Canada or the United States (the countries accounting for most of these transfers in the region).
Table 16.Transfers to Disposal of Pollutants unique to the TRI or NPRI, 2018
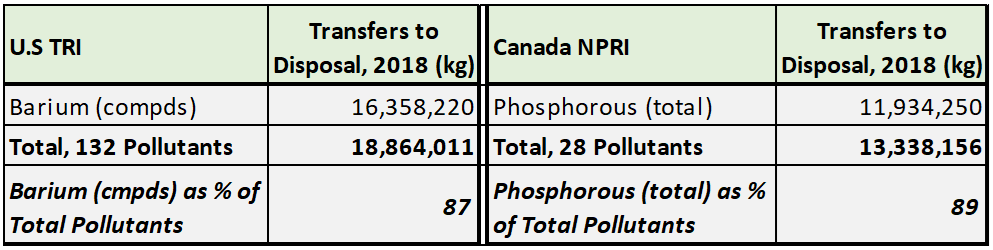
Table 16 also reveals that in 2018 US facilities reported close to 19 million kg in transfers to disposal of 132 substances that are not subject to reporting in Canada (with barium compounds, reported in largest proportions by electric utilities, accounting for 87% of the total). Meanwhile, Canadian facilities reported more than 13 million kg of 28 substances that are not subject to reporting in the United States (with total phosphorus dominating, mainly because of reporting by wastewater treatment facilities).
Certain changes were made to the US TRI and Canadian NPRI pollutant lists during this period. These included:
- The addition to TRI of nonylphenol and its ethoxylates in 2015, and of 1-bromopropane in 2016, which resulted in increases of approximately 100,000 kg in transfers to disposal each year; and
- The exclusion from NPRI, in 2016, of 21 pollutants that were transferred to disposal in amounts ranging from 1 to 10,000 kg in previous years.
[53] The industry sectors examined in this chapter are at the NAICS-5 level, except for the Waste Management and Remediation (or simply, “Waste Management”) sector (NAICS code 562), due to differences among the three countries in the 4- and 5-digit NAICS codes used to represent specific activities in this sector.
[54] Because facilities can report 0 kg, the number of substances discussed in this report refers to those reported in quantities of at least 0.0001 kg.