Particulate Matter Emissions (PM2.5 PM10)
Available data for this report included only the PM10 and PM2.5 fractions of the particulate matter emissions from power plants. Emissions of particulate matter from fossil fuel-based electricity generation are available for PM10 and PM2.5, along with other parameters such as electricity generation, emission rates and fuel type.
For the United States, particulate matter emissions data presented in these tables have limited coverage compared to the data for other pollutants (c.f. Section 2.1.3).
In Canada, of the total of 189 power plants, 161 reported PM10 emissions and 166 reported PM2.5 emissions. For both PM10 and PM2.5, the ten facilities with the largest emissions accounted for more than 70% of total emissions reported by Canadian power plants for 2005. Tables 2.16 and 2.17 below show the top 10 Canadian facilities ranked by emissions of PM2.5 and PM10, respectively.
It should be noted that data on electricity generation were not publicly available for at least 50% of the plants. Power plants burning coal accounted for 75% and 61% of PM10 and PM2.5 emissions, respectively. Plants burning "other fuels" accounted for 10% of PM10 and 19% of PM2.5 emissions. Natural gas-fired power plants contributed 8% and 12% of PM10 and PM2.5 emissions, respectively; and oil-fired power plants 6% and 8%, respectively.
In Mexico, emission estimates of PM2.5 and PM10 were available for all 102 power plants. The ten plants with the largest emissions accounted for more than 56% and 61% of the total reported emissions of PM2.5 and PM10, respectively, but as Tables 2.18 and 2.19 below indicate, these plants were not the largest electricity generators.
According to the reported data for Mexico, 66.9% of PM2.5 was emitted by plants burning residual fuel oil, while coal and natural gas-fired power stations contributed 6.0% and 23.9% of PM2.5 emissions, respectively; the remainder corresponded to plants burning "other fuels." For PM10, the contributions of coal and natural gas were 10.3% and 18.6%, respectively; whereas for heavy fuel oil it was 68.0%.
In the United States, only 1,182 of the 2,728 plants reported PM2.5 and PM10 emissions; these plants accounted for 75% of the total electricity generated by all 2,728 power plants. More than 92% of the PM2.5 emissions were generated by the 250 largest PM2.5 emitters, of which 96.4% burned coal, 2.8% heavy fuel oil and 0.8% natural gas. Likewise, more than 92% of the PM10 emissions were released from the 250 largest PM10 emitters of which 96.8% burned coal, 2.4% heavy fuel oil and 0.8% natural gas.
The top 10 US facilities, ranked by emissions of PM2.5 and PM10, accounted for 16% and 15%, respectively, of the emissions of these pollutants from these 1,182 US power plants (Tables 2.20 and 2.21).
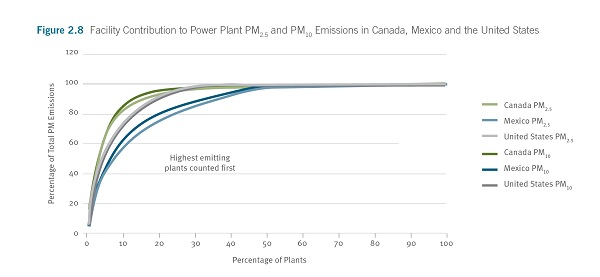
Figure 2.8 shows the contribution to PM2.5 and PM10 emissions of all the plants considered in this report, from the largest to the smallest PM emitters. It can be seen that for the United States and Canada, 20% of the total number of plants in each country accounted for roughly 90% of total PM emissions. For Mexico, 35% of the total number of plants accounted for 90% of total PM emissions.
For Canada, some emission rates were calculated based on estimated electricity generation, and should be regarded with some reservation. In the case of the United States, the majority of plants have low PM2.5 emission rates, in the ranges of 0.00–0.05 kg/MW-h, and 0.05–0.10 kg/MW-h.
The first range comprises many more natural gas-fired plants than does the second; there is a similar number of oil-fired plants in both ranges; and there are more coal-fired plants in the second range. A similar picture is observed for PM10, except that the predominant range for coal-fired plants is from 0.10 to 0.15 kg/MW-h. For the United States the PM2.5/PM10 ratio varies widely, although nearly 70% of the plants have ratios above 0.8.
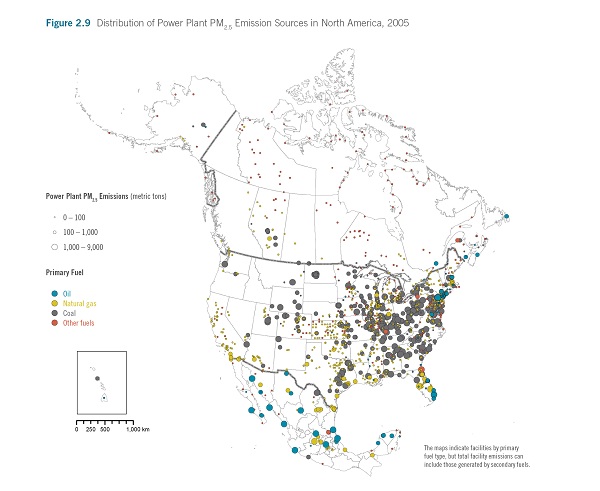
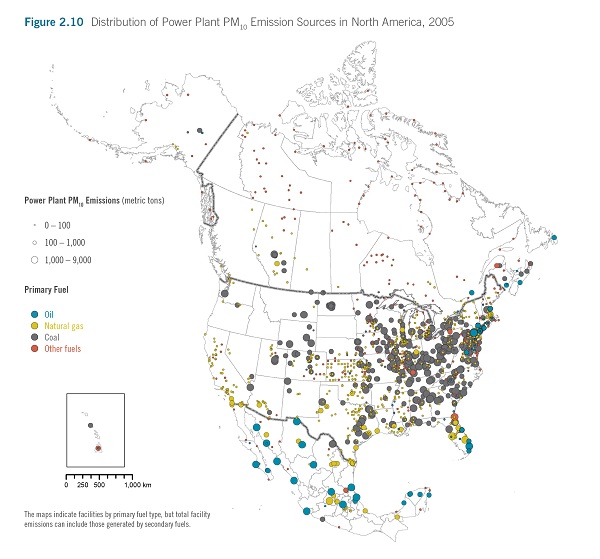
The geographical distribution of PM2.5 and PM10 sources for 2005 is shown in Figures 2.9 and 2.10, respectively. As in previous figures, the size of the dots represents the scale of emissions and the color represents the type of primary fuel used. In Canada, the geographic spread of sources emitting particulate matter (both PM10 and PM2.5) is evident, including plants in the Yukon, the Northwest Territories and Nunavut, although the most important ones are coal-fired power plants in Alberta.
Some oil-fired power plants in New Brunswick, Nova Scotia and Newfoundland and Labrador stand out for their PM10 emissions, as do some coal-fired power plants in the first two of these provinces. The same plants are important sources of PM2.5 except that some of the coal-fired power plants lie in the 0–100 t/year emissions range, whereas the oil-fired power plant emissions tend to be in the 100–1,000 t/year range.
In Mexico, there are power plants burning coal, oil or natural gas distributed across the country that are PM10 sources with emissions in the 1,000 to 9,700 t/year range. A similar pattern is observed for PM2.5. Consistent with the geographical distribution of other pollutants (SO2, NOX and Hg), there are very large numbers of power plants, mostly coal-fired, emitting particulate matter in the eastern half of the United States. As was the case with Canada and Mexico, the distribution PM10 sources in the United States is very similar to the distribution of sources of PM2.5.