Pollution and Waste
North American Power Plant Air Emissions, 2005
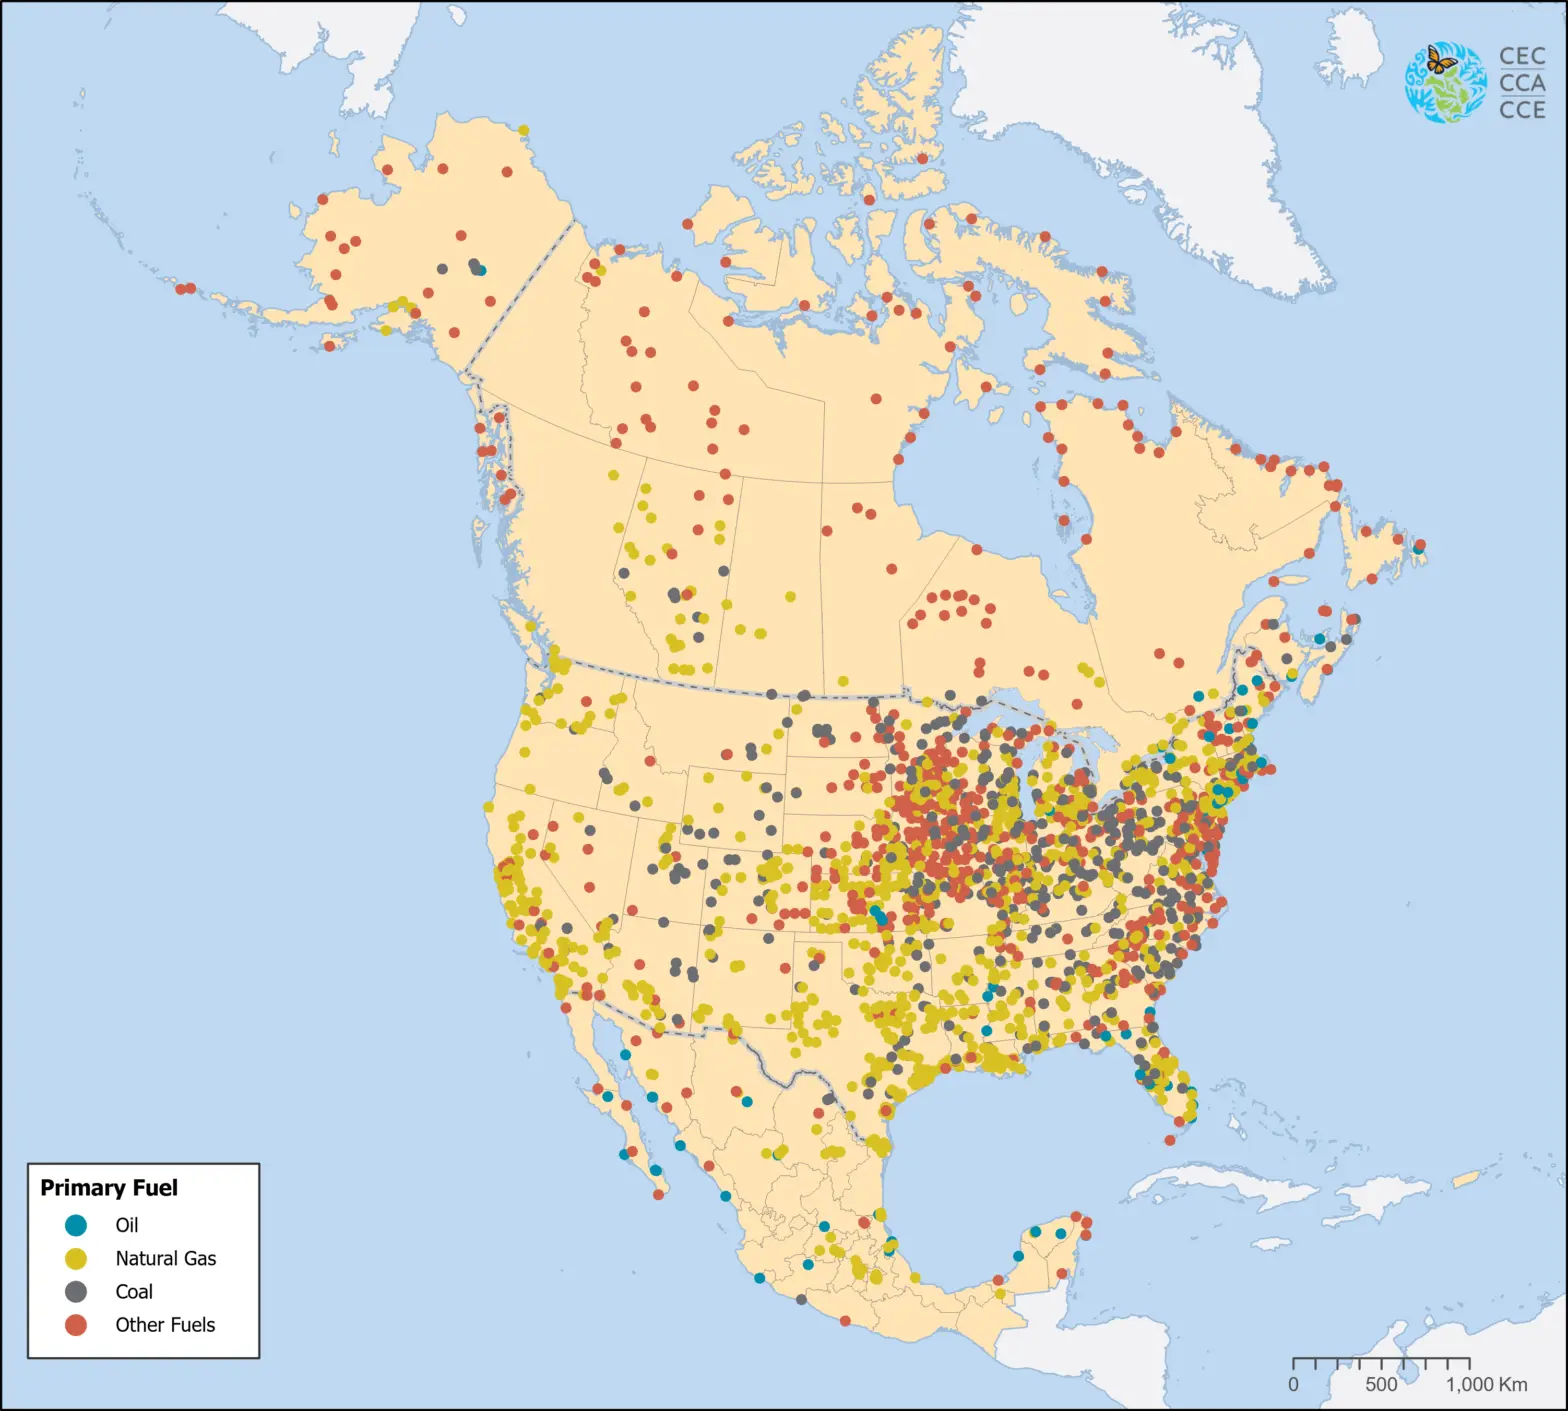
The North American Power Plants map displays over 3,000 power-generating facilities using fossil fuel sources in 2005.
These facilities are classified based on the primary source of fuel used to generate electricity: oil, natural gas, coal, or other fuels. Each map illustrates the emissions of a specific pollutant from the facilities (SO2, NOX, Hg, PM2.5, PM10, and CO2). These maps were developed for the Commission for Environmental Cooperation's 2011 publication, North American Power Plant Air Emissions.
A Google Earth (KMZ) map of the 3,144 power plants and their air emissions is also available.
For more information, please visit: https://www.cec.org/powerplants
The data used to create these maps were provided by multiple agencies from each country.
Canada:
- National Pollutant Release Inventory (NPRI), 2005
- Greenhouse Gas Emissions Reporting Program (GHGRP), 2005
- Statistics Canada, 2005
United States of America:
- Emissions and Generation Resource Integrated Database (eGRID2007), 2007
- National Emissions Inventory (NEI), 2005
Mexico
- Inventario Nacional de Emisiones de México (INEM), 2005
- Comisión Reguladora de Energía (CRE), 2005
- Secretaría de Energía (SENER), 2005
- Comisión Federal de Electricidad (CFE), 2005
- Comisión de Cooperación Ambiental, 2009
- Estimación de Emisiones de Contaminantes Atmosféricos por Uso de Combustibles Fósiles en el Sector Eléctrico Mexicano
Downloadable Files
Contact
Questions about the North American Environmental Atlas? Contact:
Dominique Croteau
Specialist, Geospatial and Environmental Information