Estimated Truck CO2 Emissions along the Mexico City to Montreal Transportation Corridor, 2010
Map type: Pollution and Waste
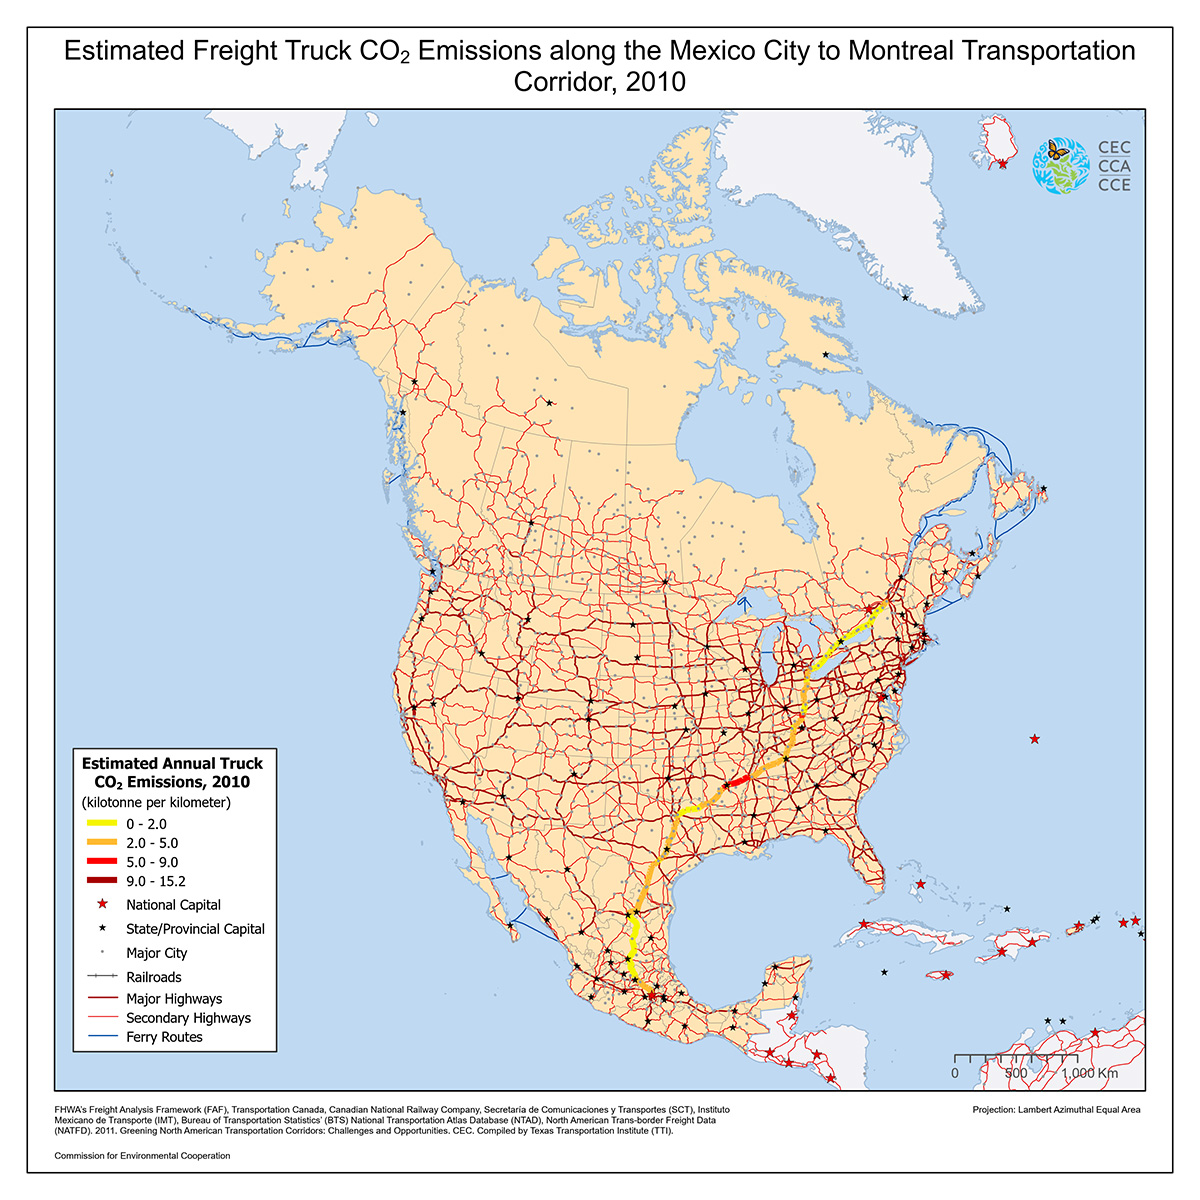
This map shows the estimated annual truck CO2 emissions for the year 2010 along the Mexico City to Montreal Transportation Corridor.
Carbon dioxide emissions are measured as kilotonnes per kilometer. The transportation corridor is one of several that cross North America and the major roads are based on the North American Environmental Atlas' base layer. Major roads are divided, multi-lane, and limited access highways. The roads included are either those that connect major centers of population or selected frontier roads. Roads under construction are not shown.
Data Source
The data were collected by the Texas Transportation Institute (TTI) from various sources as part of the Greening North American Transportation Corridors: Challenges and Opportunities paper published by the CEC.The major source for data on truck movement was the FHWA's Freight Analysis Framework (FAF and FAF2). In Canada, the information included for the estimation came from Transport Canada truck flows. In Mexico, the information that was used included truck flows from the Secretaría de Comunicaciones y Transportes (SCT) and the Instituto Mexicano de Transporte (IMT). Other data sources encompass the Bureau of Transportation Statistics' (BTS) National Transportation Atlas Database (NTAD) and North American Transborder Freight Data (NATFD), and other freight databases.
Contact
Questions about the North American Environmental Atlas? Contact:
Dominique Croteau
Project Lead, Geospatial and Environmental Information