New Land Cover Change Maps Show Human Impact on our Environment
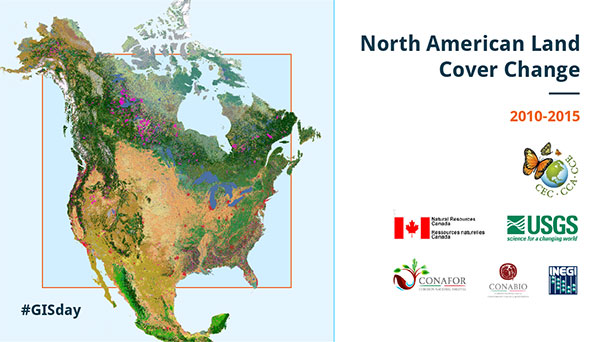
Today, our North American Land Change Monitoring System released a new map product depicting land cover change across North America from 2010 to 2015 at a 30-metre spatial resolution.
Our 2010-2015 change maps tell a story of changes in the North American environment over this time period: landslides, oil sands expansion, water-level changes, deforestation or forest recovery, conversion to cropland, mining expansion, and much more. All these changes are captured by satellites, and thanks to our trinational collaboration, we now have precise maps depicting the evolution of our shared environment over our three countries. These maps are thus invaluable for environmental research of all kinds and give us crucial insights into how land cover changes over the years.
Not surprisingly, many of these changes have been precipitated by human activity.
Here are three examples, spanning North America, of phenomena either incited by or impacting humans that depict the varying ways these maps can help us better understand landscape changes from a broader perspective:
Forest Fires in Canada’s Northwest Territories, in 2014, caused large areas around Yellowknife to change from forest to mainly grassland and barren lands. Unusually warm conditions and lack of rainfall triggered more than 130 forest fires in the area surrounding Great Slave Lake and created a forest fire season that year that has been classified as one of the most extreme in the region over the last three decades, with a lasting impact on vegetation and wildlife as well as on human populations.

The conversion of Wetlands to Aquaculture in Sinaloa, Mexico. The coastal area of Sinaloa now hosts one of the largest shrimp-farming regions in the country, with sixty percent of Mexico’s shrimp aquaculture production now concentrated in this state, intended for the national and international market. But originally this coastal region was the site of considerable wetland and mangrove habitat. When comparing 2010 to 2015, the impact of increased flooding of the land is apparent. This includes coastal modification, especially near bays and estuaries, changes to agricultural soil, and urban expansion due to economic activity.

The rapid expansion of Urban Sprawl in the Dallas-Fort Worth Area, United States, can be observed by comparing satellite images from 2010 and 2015. Fort Worth, with one of the lowest unemployment rates in the country, has grown rapidly over the period, due to the development of the aerospace, pharmaceutical, and food industries, among others. In 2018, Fort Worth became the metropolitan area with the highest annual growth rate in the nation, with an increase of 146,000 inhabitants in just that year.

About these maps and the North American Land Cover Monitoring System
These new geospatial maps, created from a composite of images assembled from satellite observations (Landsat), depict land cover change across North America from 2010 to 2015 at a 30-metre spatial resolution. They are the result of a collaborative effort that has harmonized land cover classification systems from Canada, Mexico and the United States into 19 classes, providing a seamless view of the continent at a consistent scale. Users can download the change data and view class transitions between 2010 and 2015 on a pixel-basis throughout the continent.
This geospatial dataset offers invaluable support to international organizations, nongovernmental conservation organizations, land managers, scientific researchers and others, allowing them a better understanding of the dynamics and continental-scale patterns of North America’s land cover and a tool for conducting both regional and local-level analyses.
NALCMS is a joint initiative among Natural Resources Canada (NRCan)’s Canada Centre for Mapping and Earth Observation (CCMEO), the United States Geological Survey (USGS), and three Mexican organizations: the National Institute of Statistics and Geography (Instituto Nacional de Estadística y Geografía—INEGI), the National Commission for the Knowledge and Use of Biodiversity (Comisión Nacional para el Conocimiento y Uso de la Biodiversidad—Conabio), and the National Forestry Commission (Comisión Nacional Forestal—Conafor), and supported by the Commission for Environmental Cooperation (CEC). https://www.cec.org/nalcms.
If you wish to be notified of new map layers as they become available, subscribe for notifications at www.cec.org/getmaps.
North American Land Cover Change 2010-2015
About the CEC
The Commission for Environmental Cooperation (CEC) was established in 1994 by the governments of Canada, Mexico and the United States through the North American Agreement on Environmental Cooperation, a parallel environmental agreement to NAFTA. As of 2020, the CEC is recognized and maintained by the Environmental Cooperation Agreement, in parallel with the new Free Trade Agreement of North America. The CEC brings together a wide range of stakeholders, including the general public, Indigenous people, youth, nongovernmental organizations, academia, and the business sector, to seek solutions to protect North America’s shared environment while supporting sustainable development for the benefit of present and future generations
The CEC is governed and funded equally by the Government of Canada through Environment and Climate Change Canada, the Government of the United States of Mexico through the Secretaría de Medio Ambiente y Recursos Naturales, and the Government of the United States of America through the Environmental Protection Agency.