Population density
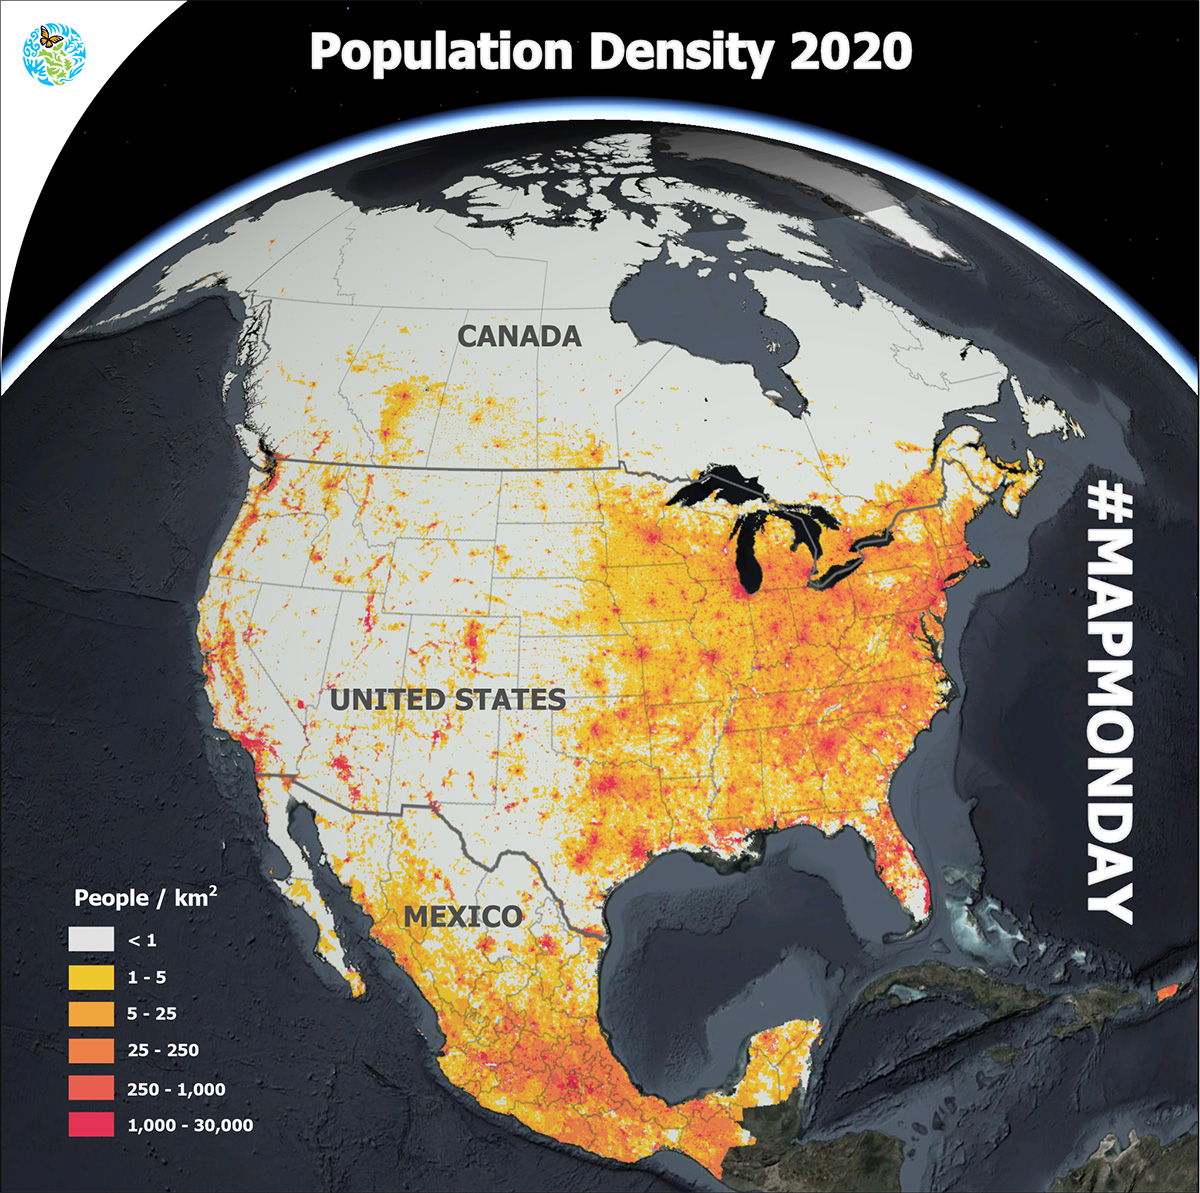
It’s #MapMonday! This month we’re highlighting population density. How many people per square kilometer are living near you? Where are most people living in North America and how does that compare across different regions?
How do we determine what counts as a highly populated area? Did you know that understanding the population density of different locales can help us better understand our relationship with natural ecosystems?
By evaluating the concentration of people in a given area with the use of census data across Canada, Mexico and the United States, we can more accurately define the level of urbanization and the relationship to the use of natural resources.
Population density data can be used by researchers, policymakers and decision-makers of all kinds to help make better decisions impacting both people and nature.
For example, population density can also be used in epidemiology to evaluate the incidence and transmission of infectious disease or used in urban planning to evaluate energy consumption and transportation needs.
It might not always seem like it, but #maps play a big role in the lives we lead today, and they help us navigate and understand the world around us.
Follow along with us every #MapMonday to learn more about the stories and information that maps can tell us about our changing world.
Check out more information about population density and other data on environmental matters in North America with our maps and geospatial information tools: https://lnkd.in/gdj2yGuh