The following pages contain guidance for different sectors of the food supply chain on how to measure food loss and waste. Each section contains a short description of the sector and guidance on how to select the most appropriate measurement method for it, as well as a case study of how a company in that sector measured (or could measure) FLW. You can review the most relevant sector or sectors.
The sectors are:
Measuring FLW should go beyond simply measuring the amount of food that leaves the food supply chain. This measurement fails to capture the impacts and benefits of reducing and preventing FLW. Preventing FLW has far-reaching economic, environmental and social benefits that can also be tracked.
Which Impacts Should I Track?
Key performance indicators can determine an organization’s success in achieving an objective or evaluating activities. Using a well-chosen suite of metrics, organizations can find out if they are achieving FLW prevention, redistribution or diversion. These metrics can also evaluate progress and tailor future interventions. Possible impacts fall into three broad categories:
- environmental impacts;
- financial impacts; and
- social impacts.
Organizations can monitor progress (and communicate success) more effectively if they use a range of appropriate metrics and consider reporting results in all three categories.
Environmental Impacts
Food production and all its associated processes (including processing, manufacturing, packaging, distribution, refrigeration and cooking) require resources, such as arable and pasture land, fresh water, fuel and chemical inputs (e.g., fertilizer, herbicides and pesticides), and cause environmental impacts, such as air and water pollution, soil erosion, emissions of greenhouse gases and biodiversity loss.
Depending on its management, FLW can cause additional environmental impacts that would not have occurred had the food been consumed. Some of these are associated with transportation of waste, land uses for landfills and methane emissions from landfills. While less important than impacts associated with production, these impacts can still be significant.
Examples of environmental impacts that an entity could track alongside FLW data are: greenhouse gas emissions, use of water, land, fertilizers and energy and biodiversity loss.
Greenhouse Gas Emissions
Greenhouse gas (GHG) emissions are the most commonly tracked environmental impact related to FLW. For most food products, the GHGs can be determined by a lifecycle analysis (LCA), which provides a full picture of the GHGs associated with the production of a food item from the point of production to the point at which it is lost or wasted. Each food item has a unique set of GHG factors depending on the land and resources needed to produce it. The GHG impact factors increase the further along the supply chain FLW is generated.
Much LCA data is publicly available. The sources below provide GHG impact factors.
- Individual product LCA studies, found via search engine
- Commercial databases such as Ecoinvent, GaBi, FoodCarbonScopeData, World Food LCA Database (Quantis) and Agri-Footprint (Blonk Consultants)
- US Department of Agriculture (USDA) Life Cycle Assessment Commons
The US EPA Waste Reduction Model (WARM) can help to assess the GHGs associated with FLW. WARM provides estimates of GHG emissions associated with baseline and alternative waste management practices, including source reduction, recycling, anaerobic digestion, combustion, composting and landfilling.
Water Use
Water is used throughout the food supply chain, including to water crops, in manufacturing processes and to wash food waste down the drain to a sewer. Three types of water can be considered when assessing environmental impacts (Hoekstra et al. 2011):
- Blue water – water withdrawn from ground or surface water sources (e.g., irrigation water)
- Grey water – the water required to dilute polluted water for it to be safely returned into the environment
- Green water – water evaporated from soil moisture (e.g., rainfall)
Most estimates of environmental impacts include only blue water and grey water, although green water is relevant in water-scarce regions.
The largest database of water impacts is from the Water Footprint Network, with the Water Footprint Assessment Tool being especially useful (Water Footprint Network 2018). When using the tool, select “Production Asssessment” and select the commodity of interest as well as its country of origin to access the data of interest. The Water Footprint Network also provides country-specific blue, grey and green impact factors for crop and animal products.
Although GHGs and water are the most common environmental impacts measured in association with FLW, several others are relevant. Because these impacts are less frequently quantified, they have fewer measurement resources.
Land Use
The impact on land use is more complicated to measure than the impact on GHGs or water. Some complicating factors are multiple cropping (where multiple crops are harvested from the same land within the course of a year) and crops that have multiple-year cycles, such as sugarcane. No simple, easily available tools yet exist to calculate land use associated with FLW but the Food and Agriculture Organization of the United Nations (FAO) Food Wastage Footprint provides global estimates of land used for food that is lost or wasted, as well as the relative impacts of a range of commodity types (FAO 2015).
Fertilizer Use
At the production level, fertilizer use associated with food loss or waste can be roughly estimated by multiplying the percentage of FLW by the total amount of fertilizer used. However, no simple method exists for other stages of the supply chain where the total fertilizer input may not be known. One study has estimated fertilizer loss at the country level using data from the FAO database, FAOSTAT (Kummu et al. 2012, FAO n.d.).
Energy Use
Most environmental impact estimates do not break out energy use from GHG estimates, but one US study found that energy embedded in wasted food represented about 2 percent of the country’s annual energy use (Cuellar and Webber 2010). The Provision Coalition’s Food Loss and Waste Toolkit based on Enviro-Stewards’ approach may help companies assess energy use relating to FLW.
Biodiversity Loss
Biodiversity loss associated with FLW is an emerging topic. Food production is the leading driver of biodiversity loss through conversion of natural habitats to farmland, intensification of farming, pollution and, in the case of fish, over-exploitation (Rockstrom et al. 2009). Some of this biodiversity loss occurs to produce food that is wasted. At the time of publication, no simple resources existed to assist in assessing potential biodiversity loss. However, tools may by developed in the future.
Financial Impacts
Most of the financial impacts of FLW are associated with disposal, however the total cost of FLW includes all resource inputs wasted along with the food. Simply focusing on disposal costs overlooks the vast majority of financial opportunities and benefits of preventing FLW. Quantifying the costs of FLW might typically involve assessing the following items:
- The purchasing costs of the incoming food and/or ingredients;
- The costs added to the food within the business (e.g., relating to labor and utilities,); and
- The costs associated with redistribution of surplus food or the disposal and treatment of FLW.
Financial impacts that can be tracked alongside FLW data include the following examples:
- The value of the food that was lost or wasted;
- The cost of FLW as a percentage of food sales; and
- The cost and benefits of investment in a food-waste-reduction program.
Two direct measurement tools can capture the weight of FLW and translate it into dollar values: smart scales in the food service sector (e.g., LeanPath or Winnow tools) and the Provision Coalition’s Food Loss and Waste Toolkit for manufacturers.
Social Impacts
Social impacts refer to the effects of FLW on humans. Examples of trackable social impacts are the value of the donated food, the nutritional content and meals wasted.
Donation Amount
A company may wish to track the amount of food it donates to food banks and other nonprofits. Records of these donations are usually kept and just need to be collated. If a company does not maintain records, food banks may record how much food they have received from each company.
Nutritional Content of FLW
The nutritional content of FLW can be assessed in several ways, including calories, macronutrients (i.e., carbohydrates, fat and protein), fiber and other micronutrients. The most comprehensive database of food types and their associated nutrients is USDA’s National Nutrient Database for Standard Reference, which contains information on 8,100 food items and 146 components, including vitamins, minerals, amino acids and more (USDA n.d.). By sorting FLW by food type and multiplying the amount of FLW by the nutrient of interest in the database, you can estimate the nutritional content of the FLW.
Meals Wasted
Expressing FLW in terms of meals wasted can show laypeople the impacts of FLW. Meals are generally expressed as a number of calories, usually 600–700.[1] To determine the number of meals wasted, first determine the total caloric content of the waste using the USDA National Nutrient Database for Standard Reference, then divide that number by the calories in a typical meal. This will provide a total number of meals, although it should be specified that these are not necessarily healthy or complete meals. Calories are just one measure of nutrition and depending on the type of FLW, meals may not be the best measure.
[1] There is no correct number of calories to consume per day (since proper intake depends on energy expenditure) but several health organizations suggest 2,000 calories per day for an adult as a reasonable average. Therefore, assuming three meals a day, the average meal would be 600–700 calories.
It is difficult to reduce FLW without understanding what causes it. For example, after performing a waste composition analysis, a restaurant may discover that it is discarding a large amount of tomatoes each week, but the waste data do not tell it why those tomatoes are being discarded. This module describes how to track causes of FLW when the information is not obvious in the quantification method.
Defining Causes and Drivers
There are two layers to identifying the cause of FLW – the immediate reason why something became FLW, and the underlying factor that led to the waste. The FLW Standard uses the terms “causes” and “drivers.” A cause is defined as the proximate or immediate reason for FLW, while a driver is defined as an underlying factor that played a role in creating that reason (FLW Protocol 2016a). Tables 4 and 5 list some possible causes and drivers by stage in the food supply chain.
Table 4. Some Causes of FLW by Stage of the Food Supply Chain
| Primary Production | Processing and Manufacturing | Distribution and Wholesale | Retail | Food Service/ Institutions | Household |
|---|---|---|---|---|---|
| Spillage
Cosmetic or physical damage Damage from pests or animals Not harvested Unable to sell due to quantity or size Unable to reach market |
Spillage
Trimming during processing Rejected from market |
Cosmetic or physical damage
Spoilage Past sell-by date Rejected from market Unable to reach market |
Product recall
Food prepared improperly Food cooked but not eaten Cosmetic damage Spoilage Past sell-by date |
Product recall
Food prepared improperly Food cooked but not eaten Cosmetic damage Spoilage |
Product recall
Food prepared improperly Food cooked but not eaten Cosmetic Spoilage Past sell-by or use-by date |
Source: FLW Protocol 2016a, CEC 2017.
Table 5. Some Drivers of FLW by Stage of the Food Supply Chain
| Primary Production | Processing and Manufacturing | Distribution and Wholesale | Retail | Food Service/ Institutions | Household |
|---|---|---|---|---|---|
| Premature or delayed harvesting
Poor harvesting technique/ inadequate equipment Lack of access to market or processing facilities Price volatility Overproduction Improper storage |
Outdated or inefficient equipment and processes
Stringent product specifications Human or mechanical error resulting in defects |
Excessive centralization of food distribution processes
Lack of effective cold-chain management Stringent product specifications Poor transportation infrastructure Failure in demand forecasting Ineffective packaging or storage conditions |
Regular replenishment of stocks to evoke abundance
Package sizes too large Failure in demand forecasting Too many products offered Lack of system for food donation |
Regular replenishment of buffet or cafeteria to evoke abundance
Portion sizes too large Failure in demand forecasting Too many products offered Lack of system for food donation Improper training of food preparers
|
Overpurchase
Inadequate planning before shopping Lack of cooking knowledge Confusion over date labels Inadequate or improper storage of food Desire for variety, resulting in uneaten leftovers |
Source: FAO 2014, FLW Protocol 2016a, CEC 2017.
If a restaurant discards a large amount of tomatoes, the immediate cause might be that the tomatoes spoiled after sitting unused in the kitchen. The underlying driver may be that the restaurant is incorrectly forecasting the amount of tomatoes it needs each week. Perhaps a previously popular dish that requires tomatoes is not selling as much as anticipated, but the restaurant is continuing to order tomatoes based on prior rather than current demand.
In this example, simply knowing that a large amount of tomatoes was being disposed of was not enough to determine the correct course of action to reduce waste. However, once the tomato FLW was linked to a cause (e.g., spoilage after not being used) and an underlying driver (e.g., failure of demand forecasting), the restaurant is now able to take action to reduce the FLW (e.g., reduce the weekly order for tomatoes or adjust the menu to remove the dish not being ordered).
In more complicated cases, the causes and drivers may not be clear. Meeting with an outside waste-reduction consultant may be beneficial. Numerous firms make detailed sustainability audits of facilities and organizations to address root causes of inefficiencies and unsustainable practices.
Incorporating Causes into FLW Quantification Methods
The methods described in this guide differ in how well they track the causes and drivers of FLW. Table 6 provides a list of methods, whether they can track causes and how to best do so.
Table 6. Tracking Causes by Method
| Method | Can it track causes? | How to track causes with the method |
|---|---|---|
| Direct weighing | Yes | Although direct weighing provides only numerical data, staff can be instructed to log causes while weighing the FLW. This will provide an additional data point about how the FLW occurred. |
| Waste composition analysis | No | A waste composition analysis will not directly provide information on causes of FLW, since the waste is being analyzed after it has been discarded. For this reason, waste composition analyses are often paired with a survey or process diary to generate qualitative data on causes and drivers assessed in tandem with the waste analysis. |
| Records | Not usually | Because records are kept for purposes other than FLW quantification, they are less likely to contain information relating to FLW causes and drivers. However, some records will have information that can help identify causes. (For example, a repair record for a piece of faulty equipment may help identify a cause of food waste.) Usually, a diary or survey will likely need to be implemented to generate qualitative data. |
| Diaries | Yes | A diary can be used to determine causes and drivers of FLW. The diarist can be asked to provide information on why the FLW occurred while recording it. |
| Interviews/Surveys | Yes | A survey can be used to determine causes and drivers of FLW. The respondent can be asked to provide information about why FLW occurs within their boundaries. |
| Proxy data/mass balance | No | Because inference by calculation is a mathematical operation based on material flows and proxy data, it will not provide information about causes and drivers of FLW. It provides only a quantitative estimate of the amount of FLW occurring within a given sector or commodity type. An additional analysis of the relevant sector or commodity will be necessary to understand the causes of FLW. |
Source: Authors.
How to Track Causes and Drivers
Causes and drivers can be tracked simply by capturing information on causes while numerical estimates of FLW are being logged. In most cases, only the immediate cause will be available at first and additional research may be needed to detect the driver. Table 7 shows an example of how causes and drivers can be tracked alongside numerical estimates of FLW.
Table 7. Tracking Causes and Drivers
| Food Type | Amount | Stage of the Supply Chain | Cause | Driver |
|---|---|---|---|---|
| Wheat | 1000 kg | Primary production | Eaten by pests | Improper storage on the farm |
| Apples | 10 kg | Processing | Trimmings | Inefficient equipment trims more than necessary |
| Strawberries | 40 kg | Distribution and wholesale | Spoilage / Damage during transport | Lack of effective cold-chain management / Improper packaging / Excessive centralization of distribution processes |
| Beef | 100 kg | Retail | Spoilage | Improper refrigeration |
| Fish | 34 kg | Food service/ institution | Spoilage | Failure in demand forecasting |
| Milk | 500 g | Household | Past sell-by date (but not spoiled) | Confusion over meaning of date labels |
Note: the information in this table is illustrative.
Source: Authors.
Once you’ve determined that it is worthwhile to measure FLW, define what FLW means in your operations and how you will communicate that information, both internally and externally. Reporting FLW data publicly has multiple benefits: it raises awareness of the issue, allows for information-sharing among businesses, provides information to policymakers and assists FLW tracking efforts over time.
Public reporting should align with the Food Loss and Waste Accounting and Reporting Standard, or FLW Standard. The FLW Standard is “a global standard that provides requirements and guidance for quantifying and reporting on the weight of food and/or associated inedible parts removed from the food supply chain” (FLW Protocol 2016a). The standard clarifies definitions and shows the possible destinations of FLW when it is removed from the human food supply chain.
Tracking Progress on Preventing FLW
The FLW Standard does not provide specific guidance on tracking progress on preventing FLW. However, prevention can be tracked by establishing a base year as a starting point and assessing prevention efforts against that baseline. If total production is increasing or decreasing, intensive measurements (tonnes per unit of production) can better quantify how much FLW was prevented. For example, a company may set a base year of 2016 when it had 15,000 tonnes of FLW. The following year, the FLW may be 13,500 tonnes, meaning 1,500 tonnes of FLW had been prevented.
A hypothetical example of how prevention can be tracked alongside FLW amounts is shown in Table 2.
Table 2. Tracking Reduction in FLW by Measuring FLW Sent to Various Destinations over Time (tonnes/year)
| 2016 | 2017 | 2018 | |
|---|---|---|---|
| Total Production | 100,000 tonnes | 100,000 tonnes | 100,000 tonnes |
| Anaerobic Digestion | 3,000 tonnes | 4,000 tonnes | 4,000 tonnes |
| Landfill | 8,000 tonnes | 6,000 tonnes | 5,500 tonnes |
| Sewer/water treatment | 4,000 tonnes | 3,500 tonnes | 3,500 tonnes |
| Total FLW | 15,000 tonnes | 13,500 tonnes | 13,000 tonnes |
| Tonnes FLW per unit of production (percent) | 15% | 13.5% | 13% |
| Reduction in FLW (percent relative to 2016) | 0% | -10% | -13% |
Source: Authors.
Reporting Amounts of FLW
Reporting using the FLW Standard requires setting the “scope” of your FLW, as shown in Figure 2. This scope includes only food that has been removed from the human food supply chain, meaning that food donated, redistributed or otherwise kept in the food supply chain is not included. Tracking redistribution of food may align with your objectives and can be tracked using a method similar to that outlined in the section “Tracking Progress on Preventing FLW.”
Figure 2. Scope of an FLW Inventory
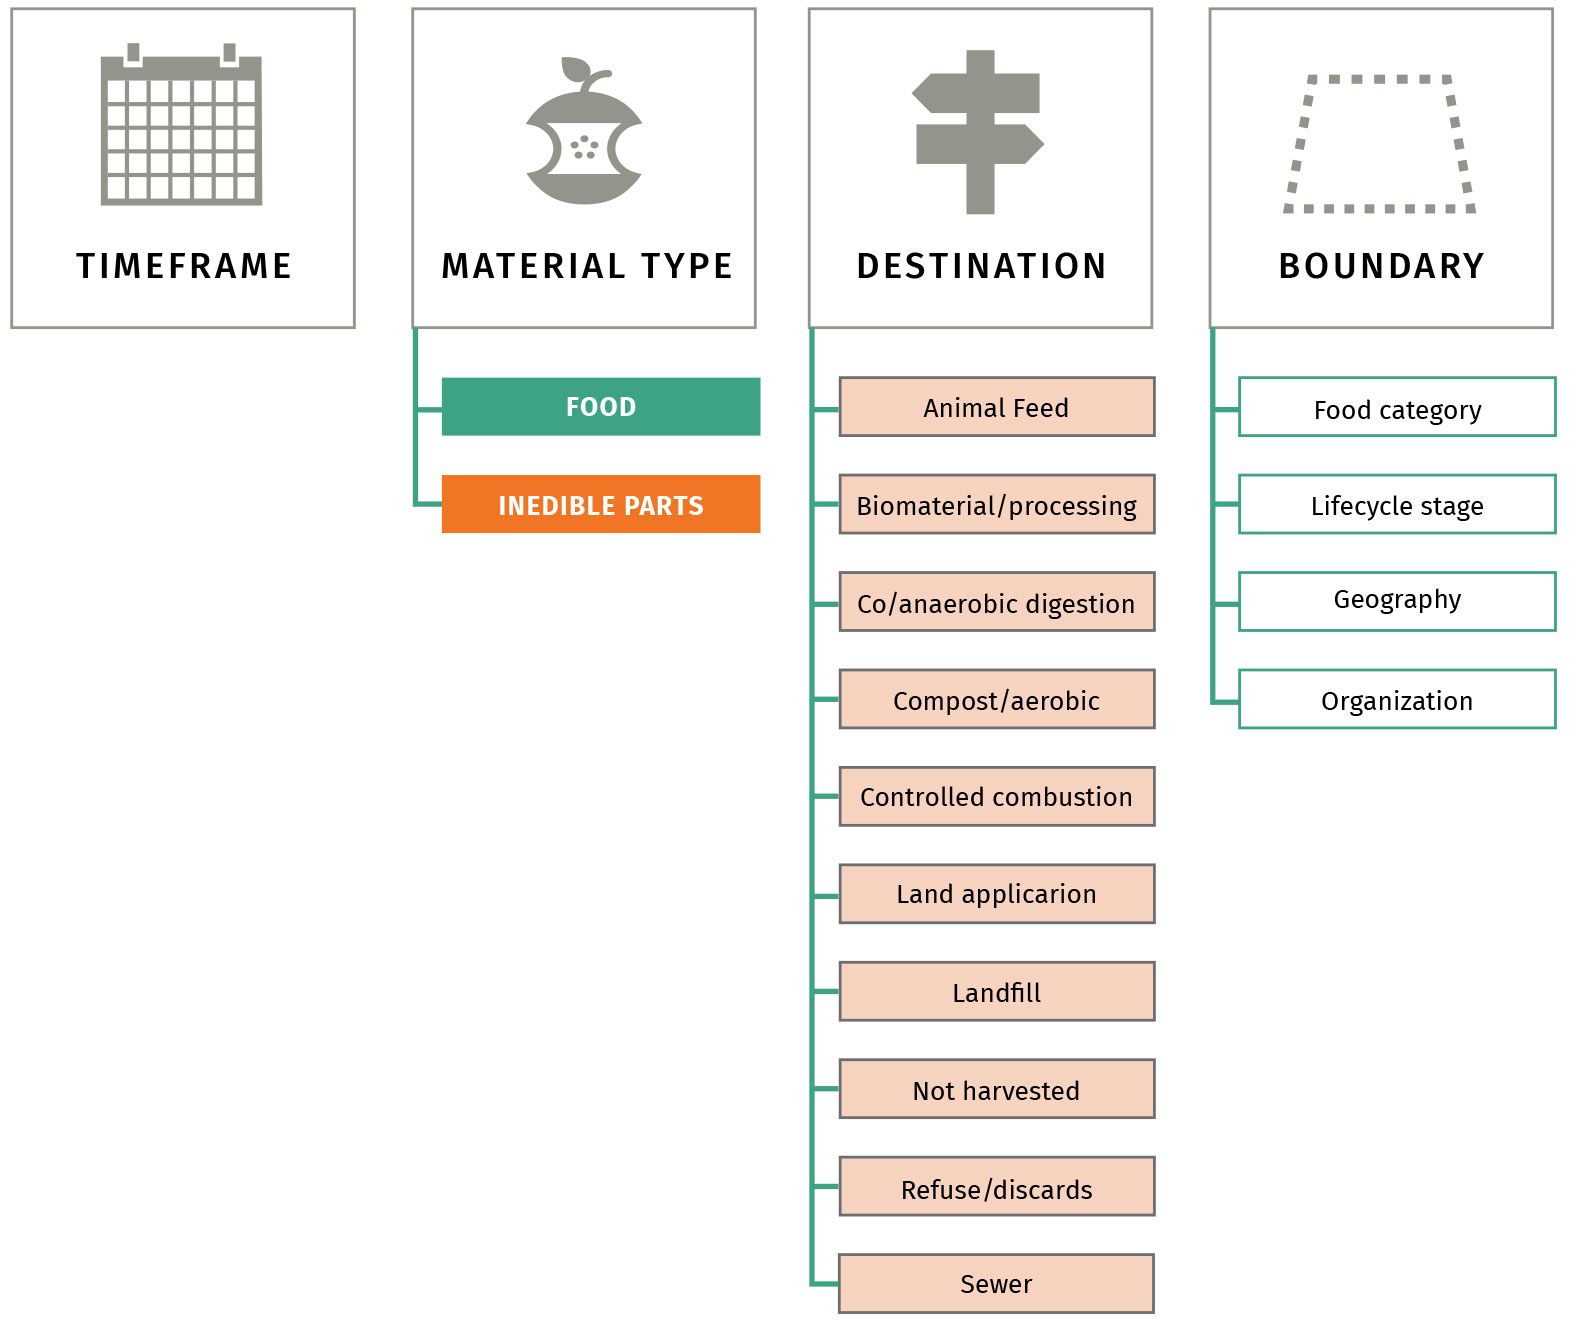
Source: FLW Protocol 2016a.
The scope has four components: timeframe, material type, destination and boundary.
Timeframe
Define the period of time for which the inventory results are reported. Typically, results are reported on an annual basis.
Material Type
Identify the materials included in the inventory: food only, associated inedible parts only, or both. Associated inedible parts are defined as the components of a food product that are not intended for consumption, such as bones, rinds or pits.
Destination
The destination is where the FLW goes when removed from the food supply chain. The 10 categories for destinations described in the FLW Standard are listed and defined in Table 3. Again, these destinations are only for FLW that has been removed from the human food supply chain and does not include prevention or redistribution of FLW, which can be tracked as described in the module “Tracking Progress on Preventing FLW.” Food that is distributed to humans outside the marketplace is not considered to be lost or wasted, since it is not sent to a destination.
Table 3. Definition of FLW Destinations used in the FLW Standard
| Destination | Definition |
| Animal feed | Diverting material from the food supply chain to animals |
| Bio-based materials/biochemical processing | Converting material into industrial products |
| Codigestion/anaerobic digestion | Breaking down material via bacteria in the absence of oxygen |
| Composting/aerobic processes | Breaking down material via bacteria in oxygen-rich environments |
| Controlled combustion | Sending material to a facility that is specifically designed for combustion in a controlled manner |
| Land application | Spreading, spraying, injecting or incorporating organic material onto or below the surface of the land to enhance soil quality |
| Landfill | Sending materials to an area of land or an excavated site specifically designed to receive wastes |
| Not harvested/ plowed-in | Leaving crops that were ready for harvest in the field or tilling them into the soil |
| Refuse/discards/litter | Abandoning material on land or disposing of it in the sea |
| Sewer/wastewater treatment | Sending material down the sewer, with or without prior treatment |
| Other | Sending material to a destination different from the ten listed above |
Source: FLW Protocol 2016a.
Food that is recovered for donation to feed hungry people, and that would otherwise be lost or wasted, is generally not considered to be FLW and therefore not identified as a destination in Figure 2. Some organizations may also exclude animal feed and bio-based materials/biochemical processing (where material is converted into industrial products) from their definition of FLW.
While definitions and scope of FLW can differ, it is nonetheless important to measure all possible end destinations of recovered food and FLW to support efforts to minimize operational inefficiencies.
Boundary
The boundary has four components:
- The food category, or the types of food included in the inventory;
- The lifecycle stage, or the stages of the food supply chain (e.g. processing and manufacturing, retail) included in the inventory;
- Geography, or the geographic borders within which the inventory occurs; and
- Organization, or the type of unit (e.g., household or factory) within which the FLW occurs.
Why Scope Matters
Disclosing the scope of an inventory is important because numerous definitions of “food loss and waste” exist. Some include only food but not inedible parts, while others consider only a subset of the possible destinations in the FLW Standard. By disclosing the scope of an inventory, a business or government clarifies its definition of FLW, thus allowingfor more accurate comparisons and tracking of FLW over time.
Additional Resources for Reporting
The FLW Standard contains a number of reporting resources. Chapter 6 outlines the process for setting a scope, and Chapter 13 provides additional guidance on reporting. A sample reporting template and customizable scope template are available for download.
Measuring and reducing food loss and waste is a big adjustment for many businesses, institutions and other organizations. Achieving significant reductions means challenging key assumptions about how a system operates. To accomplish significant change, you must prepare for it.
Within an organization, individuals will find many reasons to resist taking action on FLW. These concerns are often legitimate and should not be disregarded. However, they generally fall into broad categories.
“We don’t waste any food.”
FLW occurs whenever food that could have otherwise been sold and safely eaten is discarded. Opportunities to prevent and reduce FLW exist in all organizations and all stages of the food supply chain (i.e., from food production to consumption). Causes of FLW at different stages of the supply chain are highlighted in Table 4 of this guide.
While some organizations may focus on directing wasted food to beneficial end uses, such as animal feed, bioproducts and composting, they can profit more by taking steps to minimize the amount of FLW generated in the first place.
Simply put, FLW represents an operational inefficiency to an organization—the costs of which compound over time. Minimizing the amount of FLW generated from the outset (i.e. before it needs to be managed as waste) is good for the long-term financial health of an organization. Measurement helps to identify where those money saving opportunities exist, by pinpointing where ongoing FLW is generated within a facility.
“We already have too much going on to measure something else.”
Many sustainability managers are already tasked with overseeing various measurements, such as greenhouse gas (GHG) emissions or water use. Measurement of FLW can seem like an added burden. However, FLW represents an operational inefficiency that not only costs a business directly but also relates to many other environmental impacts, including land, water, and greenhouse gases. Profit margins for food businesses are often slim and addressing inefficiencies can cause significant benefits for a company’s bottom line. So although FLW may seem like “just another thing to measure,” it in fact can lead to significant benefits for the business.
Initial measurements may be aided by existing records to provide a cost-effective start. Inventory records and waste transfer receipts can provide an early estimate of FLW levels with minimal investment. These records can help to ease whatever time burden that FLW measurement may represent for a company or organization. The “Records” section in Appendix A provides more information about using such documents to estimate FLW levels.
“It’s not worth the cost to measure FLW.”
The cost of measuring and implementing changes to prevent and reduce FLW is small relative to the long-term economic upside. Measuring FLW helps to identify where operational and process inefficiencies may exist, and also helps to signal where corrective action is needed. Many approaches to measuring FLW can be achieved with minimal investment, while others may require higher levels of investment. The “Sector-Specific Guidance” module in this guide offers tables displaying a range of methods for measuring FLW along with the level of resources required.
The upfront costs associated with FLW measurement, prevention and reduction are frequently paid back within a relatively short time period, often within a period of less than one year. The module “The Business Case for FLW Measurement, Prevention and Reduction” provides more information about payback periods for investments.
“This is the way we’ve always done things.”
Generating FLW is often built into the assumptions of how a business or organization operates. For example, in a restaurant that operates a buffet, a certain amount of leftover food may be expected as “the cost of doing business.” However, measuring those leftovers might pinpoint opportunities to prevent and reduce FLW and save money (e.g. using smaller plate sizes, discontinuing unpopular dishes).
Different parts of a business or organization will also have different perspectives on FLW. A chef in a restaurant may think of “food waste” as food that gets thrown away from the refrigerators, but not consider waste from food preparation or plate waste. A server in that same restaurant may not think about food that’s getting thrown away from refrigerators, but may be very aware of the food that customers leave on their plates. By ensuring that everyone is using the same definition and considering all potential sources, you may be able to overcome some resistance to FLW measurement and reduction. The “Setting Your Scope” module of this guide can help you establish a common definition.
“This isn’t working.”
If a change is not going smoothly it is important to understand why this is the case. Each of the following elements can greatly improve the likelihood of success:
- senior management commitment and support
- sufficient resources (funding, time, expertise)
- concrete plan that allocates responsibilities
- employee awareness and training
- internal “champions” to foster action
In one case, the Provision Coalition worked with Ippolito Fruit & Produce in Canada to prevent and reduce FLW in its operations. For the “reinforcement” stage in the change management process, they identified key steps to help keep the change in motion (Mereweather 2018):
- Gathering feedback from employees
- Developing accountability and performance management systems
- Auditing and identifying compliance with the change
- Finding root causes of FLW and taking corrective action
- Recognizing, celebrating and rewarding successes
These steps can help keep people on board with the difficult process of making a change toward FLW measurement, prevention and reduction. Like any new change, there will be challenges along the way. But if a business has a strong case and rationale, these challenges can be overcome.
Regional and global institutions are increasingly recognizing the importance of addressing FLW. The CEC Strategic Plan 2021-2025 identifies the circular economy as a key pillar of achieving greater sustainability, pointing out that “food loss and waste entails enormous social, environmental and economic costs” (CEC 2020).
Additionally, in 2015 the United Nations General Assembly adopted a set of 17 Sustainable Development Goals to end poverty and protect the planet. Among these goals is a target (known as Target 12.3) to halve per capita global food waste at the retail and consumer levels and reduce food losses along production and supply chains by 2030.
Businesses, organizations and others are also realizing the importance and benefits of addressing food loss and waste, but many have to start by making their own internal business case for action. Across the food industry, FLW is often buried in operational budgets, where it is accepted as the cost of doing business. However, business leaders around the world are recognizing that reducing FLW is an opportunity to improve their bottom lines while contributing to food security and environmental goals. Although measuring FLW may involve some upfront costs, ample evidence shows that the benefits of measuring and reducing FLW far outweigh the long-term costs of not addressing it. The upfront costs of quantifying FLW for the first time and implementing an FLW prevention and reduction program can lead to a steady stream of financial benefits for years with only minimal continued investment.
An illustrative list of costs and benefits associated with measuring FLW is shown in Table 1.
| Costs | Benefits |
|---|---|
|
|
Source: Authors.
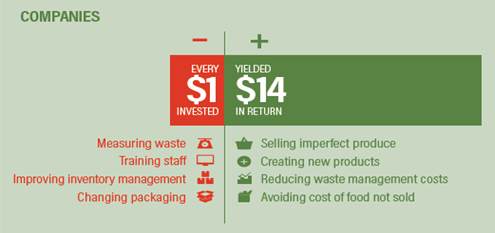
When starting to measure FLW, businesses often see a quick payback. In many cases, a suite of simple solutions can quickly and dramatically cut FLW and its associated costs. Many organizations can achieve a positive return on investment within just one year. In fact, as shown in Figure 2, it has been found that businesses tend to experience a median savings of $14 for every $1 invested on FLW measurement, prevention and reduction (Hanson and Mitchell 2017).
Figure 2: Average Return on Investment for FLW Prevention and Reduction
Financial savings and increased revenue carry on over time with minimal continued investment; especially as “best practice” behaviors and habits for reducing FLW become engrained in a business’s standard operating procedures. The positive effects of more efficient business operations compound over time.
In addition to financial benefits, reducing FLW can contribute to environmental and corporate social responsibility goals, brand recognition and improved stakeholder relationships. These impacts are discussed in greater detail in the “Selecting Key Performance Indicators and Identifying Impacts” module of this guide.
Making Your Own Business Case
Although evidence shows that reducing FLW generally results in economic gains, managers may still need to establish the benefits for their own companies.
To make the case, follow two basic steps:
FIRST, DETERMINE HOW MUCH FOOD LOSS AND WASTE IS COSTING YOUR COMPANY. Waste management fees (e.g., transport, landfill, composting, etc.) account for a relatively small portion of the true cost of FLW to your organization. Focus on the value of the food as it moves through the supply chain and identify processes, activities and services that contribute to unsold surplus and wasted food to find opportunities for improvement. To maximize potential economic savings, focus on FLW attributed to normal day-to-day business operations (versus atypical occurrences like broken equipment). Many businesses assume a certain amount of waste as being fundamental to their operations, so these assumptions should be checked and challenged as well.
For example, imagine a manufacturer that produces canned tomatoes. This manufacturer sends a tonne of oversupplied tomatoes to the landfill each month at a cost of $100. However, that same amount of tomatoes is valued at $900 at the time it is removed from the food supply chain. So in actuality, the cost of the FLW is the $900 in lost product value in addition to the $100 in disposal fees, resulting in a total loss of $1,000 each month.
For another example, imagine a restaurant that generates FLW as part of its front-of-house (dining area) and back-of-house (preparation area) operations. After measuring the FLW that is generated on the diner side, the owners find that much of the FLW is from bread that is given to customers for free before ordering their meals, costing $200 in surplus bread to be sent to landfill. In the kitchen, the FLW is found to be primarily due to over-ordering of food, costing $800 worth of food to be sent to landfill. This same amount of food costs the restaurant $100 a month to be sent to landfill, meaning all of the FLW combined is costing the restaurant $1100 a month.
One useful tool that can be used to estimate the cost of FLW to a business is the Provision Coalition’s Food Loss and Waste Toolkit, which provides a step-by-step calculator for determining the value of FLW as it moves through processing and manufacturing. Although the toolkit is intended for use by manufacturers, the principle behind it can be adapted to other sectors.
SECOND, DETERMINE THE POTENTIAL BENEFITS OF TAKING ACTION TO PREVENT FOOD LOSS AND WASTE. After assessing the cost of FLW, assess the costs associated with taking action to prevent or reduce it. For example, in the manufacturing example above, the tomato processor may discover that 2.5 tonnes per month of tomatoes, which could be used for tomato soup, are being sent to a landfill. The soup is valued at $2,000 per tonne and the cost of the equipment necessary to produce the soup is a one-time investment of $10,000. So in this case, reducing the wasted tomatoes by using them in soup would pay for itself in two months and generate $5,000 per month in profit from that point onward. Even if the company did not want to redirect the tomatoes to a new product, it could change ordering practices to avoid surplus tomato and achieve savings that way.
In the prior restaurant example, the restaurant can achieve savings by only serving bread pre-appetisers upon request (and/or reducing portion sizes) and improving inventory management of food in the kitchen. Each of these interventions is actually cost-free for the restaurant and will immediately begin to realize $1100 in savings a month if implemented fully.
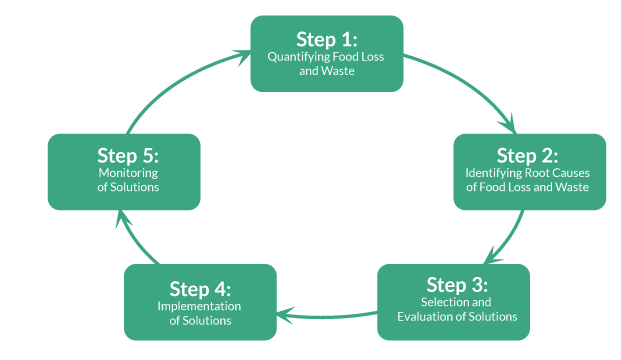
Implementation and Improvement Over Time
Once a business case has been accepted, a business or organization can implement cost-effective solutions to prevent and reduce food loss and waste. To ensure continuous improvement over time, it is important to periodically reexamine additional opportunities for reducing FLW and introduce additional corrective actions where appropriate. As seen in Figure 3, quantification and implementation are part of a “continuous improvement loop” that lead to greater improvements over time. Measuring and preventing food waste is not a one-time event, but an ongoing journey.
Figure 3: Continuous Improvement Cycle for Reducing FLW
Source: Provision Coalition 2020
A significant amount of food grown for human consumption is never eaten. In fact, by weight, about one-third of all food produced in the world in 2009 was lost or wasted (FAO 2011). In North America, approximately 168 million tonnes of FLW are generated annually: 13 million in Canada, 28 million in Mexico and 126 million in the United States. This equates to 396 kilograms per capita in Canada, 249 in Mexico and 415 in the United States (CEC 2017).
This level of inefficiency suggests three strong incentives to reduce food loss and waste: economic, environmental and social.
Economic: The huge amounts of food lost or wasted are currently considered part of the cost of doing business as usual. Rather than trying to maximize the value of food produced, companies and other organizations tend to focus on the disposal costs for the products that are lost or wasted. Companies could make significant economic gains by putting food headed for the waste stream to profitable uses.
Environmental: When food is lost or wasted, all of the environmental inputs used on that food are wasted as well (FAO 2011). That means all the land, water, fertilizer, fuel and other resources that produced, processed or transported a food item are wasted when food meant to be consumed by people is thrown away. Food waste sent to landfills creates methane – a powerful greenhouse gas. Thus, reducing FLW can reduce a company’s environmental footprint.
Social: Surplus edible food can be redistributed to food banks, food rescue agencies and other charities, which can direct it to food insecure populations, making good use of the food rather than disposing of it. For many companies, food donation or redistribution is an important part of corporate social responsibility activities. Food directed to human consumption is not considered to be lost or wasted.
The old adage that “what gets measured gets managed” holds true with FLW. Measuring food waste helps an organization understand the root causes of food waste and thus work to prevent it.
The Risk of Not Changing
The business-as-usual path has risks. If a company continues to operate with built-in assumptions about acceptable levels of waste, it risks being surpassed by its more innovative competitors who can turn waste into profit. The business case for reducing FLW is strong, and those who ignore this opportunity will continue to waste money and resources. Additionally, an increasing number of local, subnational and national governments are imposing disposal bans on food waste or requiring excess food to be donated (Sustainable America 2017; Christian Science Monitor 2018). If this trend continues, companies may face increased expenses from further regulations in the future.
The Food Recovery Hierarchy
When trying to reduce FLW, the first emphasis should be on prevention, or source reduction. Although some end-of-life destinations for FLW have fewer negative impacts than others (e.g., FLW going to animal feed is preferable to FLW going to a landfill), prevention should be the foremost goal. This principle is reflected in the Food Recovery Hierarchy (Figure 1) developed by the United States Environmental Protection Agency (US EPA).
Figure 1. Food Recovery Hierarchy
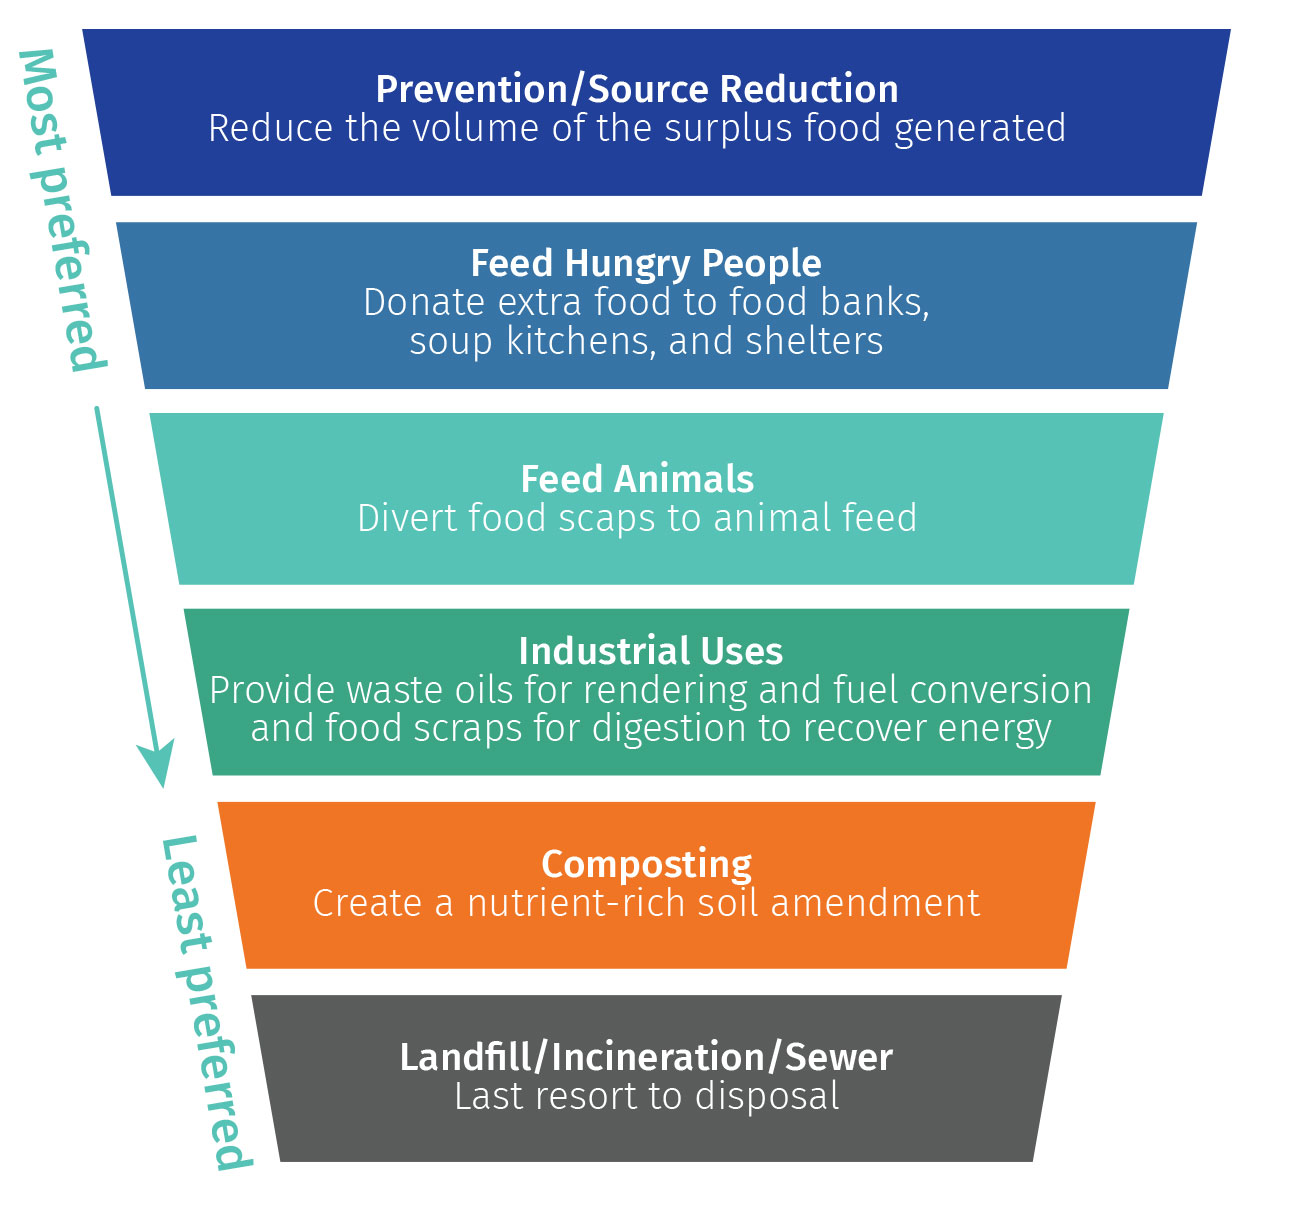
Source: Adapted from US EPA n.d.
Source reduction (i.e., preventing food waste in the first place) is the most desirable way to address FLW because it prevents the negative social, environmental and economic impacts of producing food that is wasted. Moving down the recovery hierarchy stages, less value is recovered from the FLW at each stage, until the bottom stage —landfill, incineration or sewer disposal—where negative environmental impacts are highest. From a climate perspective, tonne for tonne, preventing wasted food is six to seven times as beneficial as composting or anaerobic digestion of the waste (US EPA 2016).