1 Overview of Releases and Transfers in North America, 2014–2018
1.7 Top Facilities for Reported Releases to Air and Water, 2014–2018
The following tables present the five facilities in each country that reported the largest releases to air and water between 2014 and 2018. The country abbreviations (“CA, MX, US”) used in the tables indicate the country(ies) in which the sectors and pollutants are subject to reporting.
The data, which show that certain sectors or facilities account for the majority of the reported total in each country, illustrate the impacts of differences among the three countries in relation to both their industrial make-up and their PRTR reporting requirements. For example, Table 4 reveals that fossil fuel-based electric utilities are a top reporting sector for releases to air in all three countries, but the three top pollutants reported by Canadian and US power plants (sulfuric acid, hydrogen fluoride, and hydrochloric acid) are not subject to reporting in Mexico. The pollutants, such as hydrogen sulfide, reported by the Mexican power plants shown in this table primarily reflect the fact that these are geothermal installations that do not burn fossil fuels, but obtain their energy from underground steam or fluids.
In Canada, a top sector for releases to air is the oil and gas extraction sector; however, as mentioned earlier, this sector is currently exempt from reporting in the United States, with uneven reporting by oil and gas extraction facilities in Mexico. In the case of the pesticide, fertilizer and other agricultural chemical manufacturing sector (a top industry for releases to air in the United States and Canada), two of the top pollutants—ammonia and methanol—are not subject to reporting in Mexico.
Table 4. Top Reporting Facilities in Each Country for On-site Releases to Air, 2014–2018
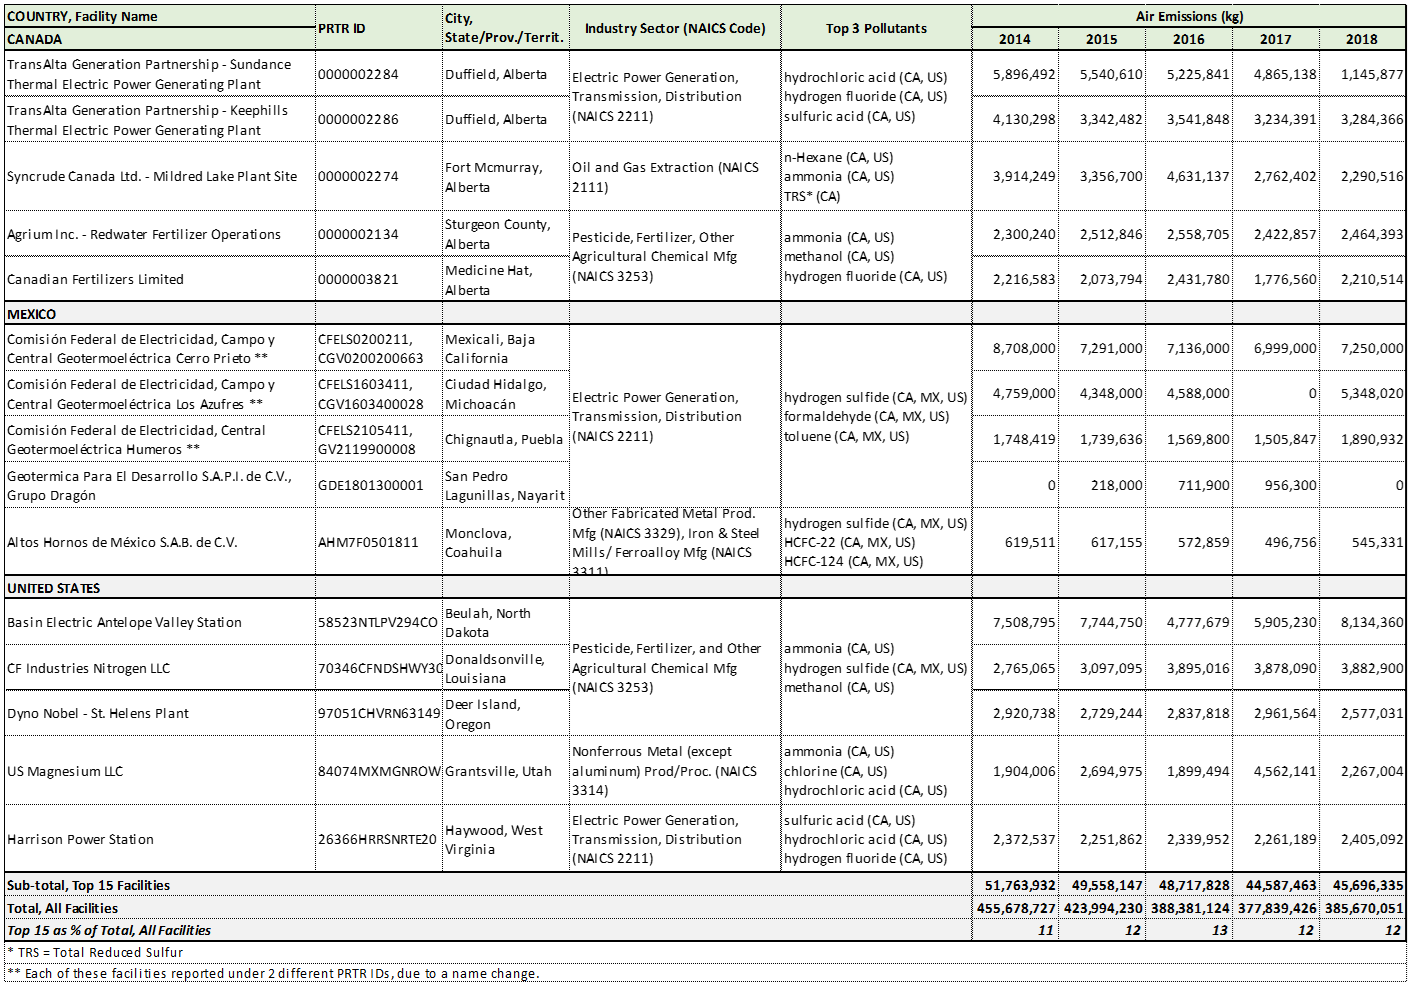
Note: Differences among national reporting requirements need to be considered when interpreting North American PRTR data. The country abbreviations (“CA, MX, US”) used in the tables indicate the country(ies) in which the sectors and pollutants are subject to reporting: Canada, Mexico, and United States (respectively).
Table 5 presents the five facilities in each country that reported the largest releases to water between 2014 and 2018. As with the preceding table, the data reveal the impacts of the differences among national PRTR reporting requirements.
For example, public water and wastewater treatment facilities, the top sector in Canada, are not subject to reporting in the United States, and the Mexican data for this sector are sparse. Moreover, of the top pollutants reported by the sector in Canada, none is subject to reporting in Mexico (with total phosphorous also not subject to reporting in the United States). Based on the large releases to water reported by Canadian wastewater treatment plants, one could expect to see similar releases in the other two countries. These data gaps underscore, once again, the need for comparable reporting across the region.
In Canada, the exception to the prominance of the sewage treatment sector for releases to water is in 2014, where the data reflect a large release by the Mount Polley copper and gold mine, the result of a spill caused by a failed tailings dam.
In Mexico, electric utilities reported the largest releases to water, with top pollutants including nickel, chromium and lead compounds. However, as with releases to air, the data for this sector varied greatly between 2014 and 2018.
In the United States, nitric acid/nitrate compounds were a top pollutant reported by all of the top facilities featured in Table 5. These compounds play key roles in the production of fertilizers and agricultural chemicals, in the finishing and etching of metals such as copper, and in the production of coal tar products.
Table 5. Top Reporting Facilities in Each Country for On-site Releases to Water, 2014–2018
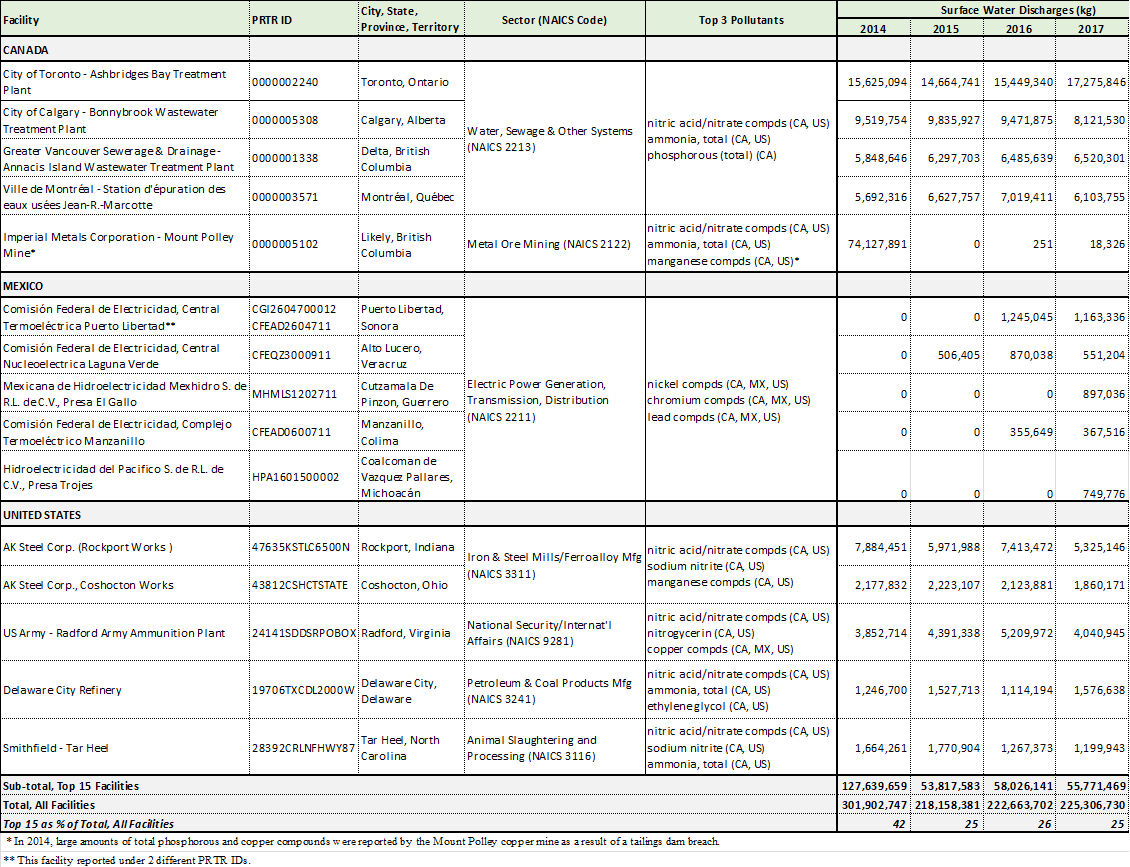
Note: Differences among national reporting requirements need to be considered when interpreting North American PRTR data.