1 Overview of Releases and Transfers in North America, 2014-2018
1.2 Types of Releases and Transfers Reported in North America
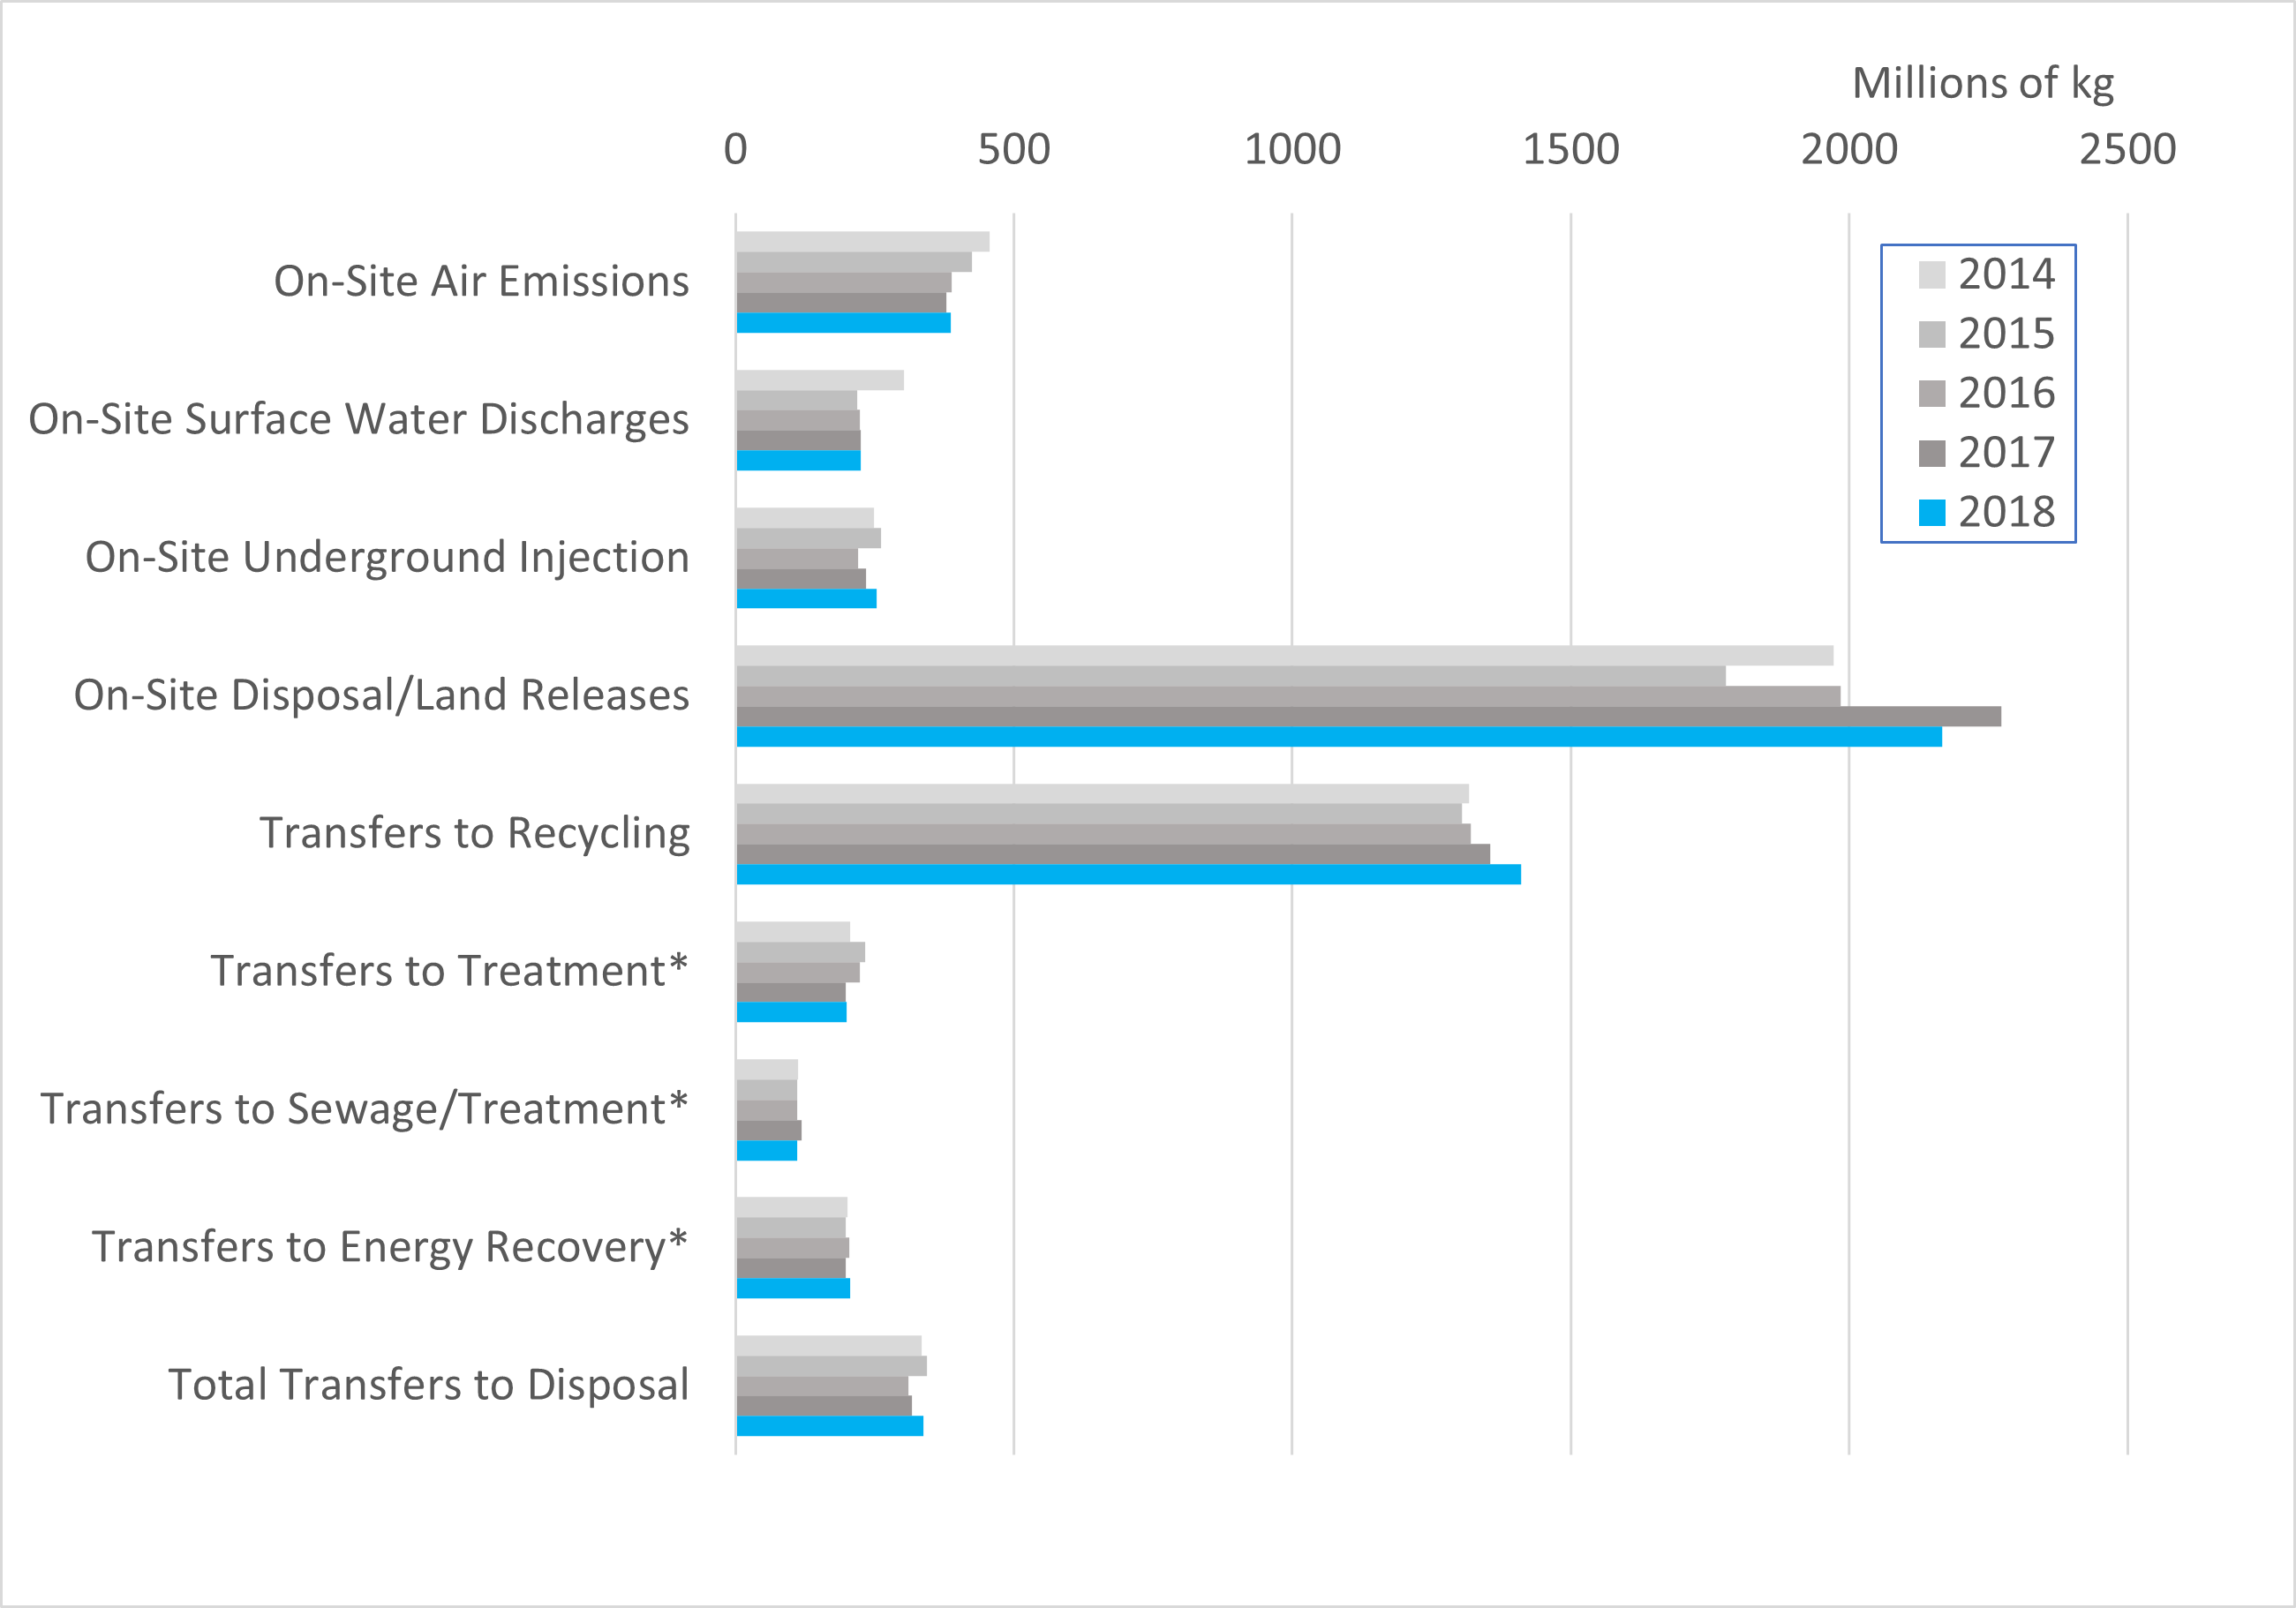
Figure 5 presents the different releases and transfers reported between 2014 and 2018.[3] It shows that the largest proportions were on-site disposal or releases to land, which generally increased during this period (representing between 38 and 43% of total releases and transfers each year). On-site releases to air accounted for approximately 7% of the total for 2018 (compared with about 9% in 2014), while releases to water represented approximately 4% of the total each year (except for 2014).
In terms of off-site transfers, recycling accounted for the largest proportion (approximately 26%) of the total each year; and transfers to disposal (which are examined in greater detail in the feature analysis of this report) accounted for approximately 6% of total releases and transfers each year.
Figure 5. Releases and Transfers by Type, North America, 2014-2018

* Note about the Taking Stock methodology: data for metals are removed from the Transfers to Treatment, Sewage, and Energy Recovery categories and placed into the Off-site Transfers to Disposal category (see “Understanding Taking Stock”).
[3] Readers are reminded that North American PRTR data do not cover all facilities, sectors, and pollutants.