Regional and global institutions are increasingly recognizing the importance of addressing FLW. The CEC Strategic Plan 2021-2025 identifies the circular economy as a key pillar of achieving greater sustainability, pointing out that “food loss and waste entails enormous social, environmental and economic costs” (CEC 2020).
Additionally, in 2015 the United Nations General Assembly adopted a set of 17 Sustainable Development Goals to end poverty and protect the planet. Among these goals is a target (known as Target 12.3) to halve per capita global food waste at the retail and consumer levels and reduce food losses along production and supply chains by 2030.
Businesses, organizations and others are also realizing the importance and benefits of addressing food loss and waste, but many have to start by making their own internal business case for action. Across the food industry, FLW is often buried in operational budgets, where it is accepted as the cost of doing business. However, business leaders around the world are recognizing that reducing FLW is an opportunity to improve their bottom lines while contributing to food security and environmental goals. Although measuring FLW may involve some upfront costs, ample evidence shows that the benefits of measuring and reducing FLW far outweigh the long-term costs of not addressing it. The upfront costs of quantifying FLW for the first time and implementing an FLW prevention and reduction program can lead to a steady stream of financial benefits for years with only minimal continued investment.
An illustrative list of costs and benefits associated with measuring FLW is shown in Table 1.
| Costs | Benefits |
|---|---|
|
|
Source: Authors.
When starting to measure FLW, businesses often see a quick payback. In many cases, a suite of simple solutions can quickly and dramatically cut FLW and its associated costs. Many organizations can achieve a positive return on investment within just one year. In fact, as shown in Figure 2, it has been found that businesses tend to experience a median savings of $14 for every $1 invested on FLW measurement, prevention and reduction (Hanson and Mitchell 2017).
Figure 2: Average Return on Investment for FLW Prevention and Reduction
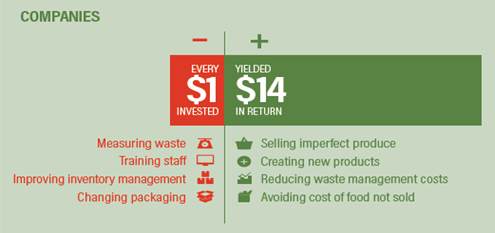
Financial savings and increased revenue carry on over time with minimal continued investment; especially as “best practice” behaviors and habits for reducing FLW become engrained in a business’s standard operating procedures. The positive effects of more efficient business operations compound over time.
In addition to financial benefits, reducing FLW can contribute to environmental and corporate social responsibility goals, brand recognition and improved stakeholder relationships. These impacts are discussed in greater detail in the “Selecting Key Performance Indicators and Identifying Impacts” module of this guide.
Making Your Own Business Case
Although evidence shows that reducing FLW generally results in economic gains, managers may still need to establish the benefits for their own companies.
To make the case, follow two basic steps:
FIRST, DETERMINE HOW MUCH FOOD LOSS AND WASTE IS COSTING YOUR COMPANY. Waste management fees (e.g., transport, landfill, composting, etc.) account for a relatively small portion of the true cost of FLW to your organization. Focus on the value of the food as it moves through the supply chain and identify processes, activities and services that contribute to unsold surplus and wasted food to find opportunities for improvement. To maximize potential economic savings, focus on FLW attributed to normal day-to-day business operations (versus atypical occurrences like broken equipment). Many businesses assume a certain amount of waste as being fundamental to their operations, so these assumptions should be checked and challenged as well.
For example, imagine a manufacturer that produces canned tomatoes. This manufacturer sends a tonne of oversupplied tomatoes to the landfill each month at a cost of $100. However, that same amount of tomatoes is valued at $900 at the time it is removed from the food supply chain. So in actuality, the cost of the FLW is the $900 in lost product value in addition to the $100 in disposal fees, resulting in a total loss of $1,000 each month.
For another example, imagine a restaurant that generates FLW as part of its front-of-house (dining area) and back-of-house (preparation area) operations. After measuring the FLW that is generated on the diner side, the owners find that much of the FLW is from bread that is given to customers for free before ordering their meals, costing $200 in surplus bread to be sent to landfill. In the kitchen, the FLW is found to be primarily due to over-ordering of food, costing $800 worth of food to be sent to landfill. This same amount of food costs the restaurant $100 a month to be sent to landfill, meaning all of the FLW combined is costing the restaurant $1100 a month.
One useful tool that can be used to estimate the cost of FLW to a business is the Provision Coalition’s Food Loss and Waste Toolkit, which provides a step-by-step calculator for determining the value of FLW as it moves through processing and manufacturing. Although the toolkit is intended for use by manufacturers, the principle behind it can be adapted to other sectors.
SECOND, DETERMINE THE POTENTIAL BENEFITS OF TAKING ACTION TO PREVENT FOOD LOSS AND WASTE. After assessing the cost of FLW, assess the costs associated with taking action to prevent or reduce it. For example, in the manufacturing example above, the tomato processor may discover that 2.5 tonnes per month of tomatoes, which could be used for tomato soup, are being sent to a landfill. The soup is valued at $2,000 per tonne and the cost of the equipment necessary to produce the soup is a one-time investment of $10,000. So in this case, reducing the wasted tomatoes by using them in soup would pay for itself in two months and generate $5,000 per month in profit from that point onward. Even if the company did not want to redirect the tomatoes to a new product, it could change ordering practices to avoid surplus tomato and achieve savings that way.
In the prior restaurant example, the restaurant can achieve savings by only serving bread pre-appetisers upon request (and/or reducing portion sizes) and improving inventory management of food in the kitchen. Each of these interventions is actually cost-free for the restaurant and will immediately begin to realize $1100 in savings a month if implemented fully.
Implementation and Improvement Over Time
Once a business case has been accepted, a business or organization can implement cost-effective solutions to prevent and reduce food loss and waste. To ensure continuous improvement over time, it is important to periodically reexamine additional opportunities for reducing FLW and introduce additional corrective actions where appropriate. As seen in Figure 3, quantification and implementation are part of a “continuous improvement loop” that lead to greater improvements over time. Measuring and preventing food waste is not a one-time event, but an ongoing journey.
Figure 3: Continuous Improvement Cycle for Reducing FLW
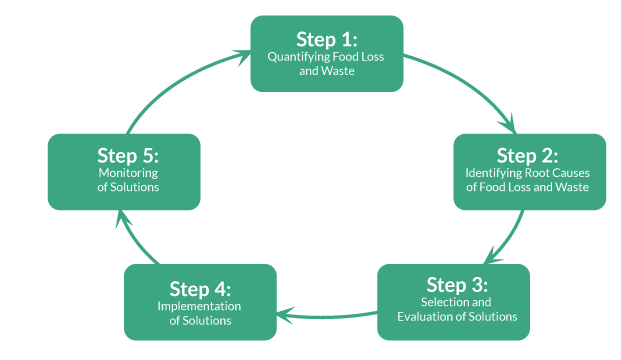
Source: Provision Coalition 2020
Introduction
A whole supply chain approach encompasses all stages in the food supply chain. This includes all activities and destinations from production to final consumption or disposal. A user of this approach would be national and local governments. A useful application of this approach would be to analyze flows of specific food products or food categories across the entire food supply chain. Such an approach can provide insights into material flows, food availability, environmental impact, food waste hotspots and opportunities for waste prevention, disposal methods, production and consumption trends, and so on. A different user could vary the working definition of FLW by adjusting the scope of their analysis to focus on specific aspects of the food supply chain.
FLW can be generated for a variety of reasons throughout the supply chain, and the user is recommended to review the relevant modules in this guide for details at each stage. Interventions are often tailored to a stage in the food supply chain with a sector-specific perspective because both existing data and direct measurements tend to occur at the sectoral level.
In addition to the methods listed in Table 15, national governments may find the Food Loss Index and Food Waste Index to be useful tools. These indices, developed by the United Nations, estimate FLW within a country based on existing data relating to key commodities within a country.
Table 15. Methods Used to Measure FLW across the Whole Supply Chain
| Method Name | Direct FLW Access Needed? | Level of Accuracy? | Level of Resources Required? | Tracks Causes? | Tracks Progress Over Time? |
|---|---|---|---|---|---|
| Methods for gathering new data | |||||
| Interviews/Surveys | No | Low-Medium | Medium-High | Yes | Yes |
| Methods based on existing data | |||||
| Mass Balance | No | Medium | Low | No | Yes |
| Proxy Data | No | Low | Low | No | No |
| Records | No | Variable* | Low | No | Yes |
| Less commonly used methods across the whole supply chain | |||||
| Diaries | No | Low-Medium | Medium | Yes | Yes |
| Direct Measurement | Yes | High | High | Yes | Yes |
| Waste Composition Analysis | Yes | High | High | No | Yes |
*Accuracy depends on the type of record used: for example, waste transfer receipts may be highly accurate for determining FLW levels, whereas other records are less accurate.
Note: The methods named are nonexhaustive.
Source: Authors.
Case Study for Measuring across the Whole Food Chain
The US Department of Agriculture (USDA) Economic Research Service (ERS) estimates all post-harvest losses through the entire food supply chain for over 200 agriculture product types through its Loss-Adjusted Food Availability Data Series. This data series helps the USDA ERS produce estimates of loss-adjusted food availability as a proxy for food consumption. To create this data series, the USDA ERS developed loss coefficients, updated primary conversion factors and compared shipping and point-of-sales data. By estimating food losses in the United States with such a high level of accuracy, the USDA ERS helps US state and local governments, food industries, nongovernmental organizations and others identify opportunities to prevent FLW. These estimates allow others to identify hotspots in which to conduct more detailed research with the aim of preventing FLW (Buzby et al. 2014).
Introduction
Within the food supply chain, the household sector encompasses all food preparation and consumption in the home. While it is uncommon for individual households to independently track their food waste, governmental or nongovernmental organizations may want to monitor household FLW. In this guide, the household sector includes only food consumed in the home. Food consumed away from home falls under the food service stage in the food supply chain.
FLW in the household can be caused by preparation mistakes, lack of proper storage infrastructure or practices, trimming for consistency, misshapen products, spillage during handling, poor portion control, contamination, overproduction, food safety concerns, or many other factors.
Methods Used to Measure FLW
Appropriate methods for FLW measurement depend on the context of who is doing the measuring and what information is available. Start by answering the five questions below.
- Do you have direct access to the FLW? Does the method require the ability to directly count, handle or weigh the FLW?
- What level of accuracy do you need? How accurate will the data gathered with this method be?
- What amount of time and resources can you assign to measuring FLW? The relative amount of resources (time, money, equipment) needed to carry out the method.
- Do you need a method that can tracks causes of FLW? Some methods can track causes associated with FLW and others cannot.
- Do you want to track progress over time? Some methods can assess increases or decreases in FLW across time to track progress.
Based on your needs and the answers to these questions, you can use Table 13 to determine which method or methods are most appropriate. If you are addressing multiple types of FLW (for example, both solid and liquid FLW), you may need to select multiple types of methods.
Table 13. Methods Used to Measure FLW in the Household Sector
| Method Name | Direct FLW Access Needed? | Level of Accuracy? | Level of Resources Required? | Tracks Causes? | Tracks Progress Over Time? |
|---|---|---|---|---|---|
| Methods for gathering new data | |||||
| Diaries | No | Low-Medium | Medium | Yes | Yes |
| Direct Measurement | Yes | High | High | Yes | Yes |
| Interviews/Surveys | No | Low-Medium | Medium-High | Yes | Yes |
| Waste Composition Analysis | Yes | High | High | No | Yes |
| Methods based on existing data | |||||
| Proxy Data | No | Low | Low | No | No |
| Records | No | Variable* | Low | No | Yes |
| Less commonly used methods at the household sector | |||||
| Mass Balance | No | Medium | Low | No | Yes |
*Accuracy depends on the type of record used: for example, waste transfer receipts may be highly accurate for determing FLW levels, whereas other records are less accurate.
Note: The methods named are nonexhaustive.
Source: Authors.
For additional guidance in selecting a method, see the FLW Quantification Method Ranking Tool published by the Food Loss and Waste Protocol, which asks 11 questions and provides a ranked list of methods based on your answers,
Case Study for the Household Level
A household survey in Mexico City and Jiutepec, Mexico collected demographic and behavioral information alongside a week-long FLW diary. Using this data together gives a more complete image of household FLW and allows analysis of the effects of various socioeconomic factors to identify root causes of household FLW. The results could inform local government agencies, NGOs and others about the potential effectiveness of intervention strategies. Such a community-centered approach lends itself to more tailored (and hopefully more effective) approaches to prevent FLW than broader surveys and diaries (Jean-Baptiste 2013).
Introduction
The food service sector includes all institutions that serve prepared food intended for final consumption. In this sector, food products are taken from their raw, processed or manufactured state and prepared in-house. The final product is usually sold in single portions, though certain business models serve food in larger portions.
Examples of organizations in this sector are: restaurants, caterers, hotels or venues that prepare and/or serve food, street vendors, convenience stores with prepared food or cafeterias within facilities such as schools, hospitals and prisons.
In this sector, there is an important distinction between pre-consumer and post-consumer waste. Pre-consumer waste is any waste that occurs before the food is on the customer’s plate and post-consumer waste is any waste that occurs after that point. Some in the sector refer to this as “back-of-house” and “front-of-house,” respectively.
Some approaches to preventing FLW in food service are listed below.
- Working with actors upstream in the food supply chain to increase the share of second-grade products that are accepted and valorized to some point.
- Improving cold-chain management and infrastructure in order to prevent spoilage or degradation during storage and transport.
- Reducing overproduction of under-consumed products or shifting from production models that routinely overproduce food (e.g., buffets).
- Rethinking purchasing models in order to maintain freshness and reduce shrink.
Methods Used to Measure FLW
Appropriate methods for FLW measurement depend on the context of who is doing the measuring and what information is available. Start by answering the five questions below.
- Do you have direct access to the FLW? Does the method require the ability to directly count, handle or weigh the FLW?
- What level of accuracy do you need? How accurate will the data gathered with this method be?
- What amount of time and resources can you assign to measuring FLW? The relative amount of resources (time, money, equipment) needed to carry out the method.
- Do you need a method that can tracks causes of FLW? Some methods can track causes associated with FLW and others cannot.
- Do you want to track progress over time? Some methods can assess increases or decreases in FLW across time to track progress.
Based on your needs and the answers to these questions, you can use Table 12 to determine which method or methods are most appropriate. If you are addressing multiple types of FLW (for example, both solid and liquid FLW), you may need to select multiple types of methods.
Table 12. Methods Used to Measure FLW in the Food Service Sector
| Method Name | Direct FLW Access Needed? | Level of Accuracy? | Level of Resources Required? | Tracks Causes? | Tracks Progress Over Time? |
|---|---|---|---|---|---|
| Methods for gathering new data | |||||
| Direct Measurement | Yes | High | High | Yes | Yes |
| Waste Composition Analysis | Yes | High | High | No | Yes |
| Methods based on existing data | |||||
| Mass Balance | No | Medium | Low | No | Yes |
| Records | No | Variable* | Low | No | Yes |
| Less commonly used methods at the food service/institutions sector | |||||
| Diaries | No | Low-Medium | Medium | Yes | Yes |
| Interviews/Surveys | No | Low-Medium | Medium-High | Yes | Yes |
| Proxy Data | No | Low | Low | No | No |
*Accuracy depends on the type of record used: for example, waste transfer receipts may be highly accurate for determing FLW levels, whereas other records are less accurate.
Note: The methods named are nonexhaustive.
Source: Authors.
Additional guidance can be found in the FLW Quantification Method Ranking Tool published by the Food Loss and Waste Protocol, which asks a series of 11 questions and provides a ranked list of methods based on your answers.
Case Study for the Food Service Sector
Sodexo has prevented FLW through its “WasteWatch powered by LeanPath” program, which reduces on site food waste by an average of 50 percent. This program uses smart scales, which categorize food waste and generate a food waste inventory that helps identify how much and where food goes to waste. These inventories and continuous direct measurement allow staff to identify hotspots, take action and monitor progress over time. Sodexo found that tailored messaging to employees improved staff engagement in the FLW prevention program and that this staff engagement was particularly impactful in the food service sector. Additionally, Sodexo identified products going to waste that could not be sold but were still safe for human consumption. In the United States, Sodexo has collaborated with Food Recovery Network, Feeding America and Campus Kitchens to connect surplus food to those in need (Clowes et al. 2018).
Introduction
Food retailers tend to have a relatively large influence on FLW throughout the supply chain. Because of their dominant buying power, retailers can influence FLW further upstream (i.e., primary production, processing and manufacturing) and even distribution. Because of their typical place right before final consumption in the food supply chain, variability within the retail sector can lead to FLW in the food service and household stages.
FLW in retail can be caused by any number of factors, including but not limited to: damage and spoilage, lack of cold-chain infrastructure, delays during transport (e.g., border inspections), variable customer demands, modification or cancellation of orders, inaccurate customer forecasting and overstocking, reliance on inefficient stocking practices or product sizes, misinterpretation of food safety standards, and misleading or confusing date labeling.
Because the specifics of this sector vary by country, so do the root causes behind the associated FLW. Generation and prevention of FLW differ from country to country and even organization to organization, and interventions must be tailored to the context.
Some approaches to preventing FLW in retail are listed below.
- Working with actors upstream in the food supply chain to increase the share of second-grade products that are accepted and valorized to some point.
- Working with actors across the food supply chain to expand value-added processing in order to increase the proportion of produced food able to eventually be consumed.
- Standardizing date labels to reduce the amount of FLW generated from confusion over food safety.
- Implementing packaging adjustments to extend the life of food products and reduce damage during storage or transport.
- Rethinking purchasing models in order to maintain freshness and reduce shrink.
Methods Used to Measure FLW
Appropriate methods for FLW measurement depend on the context of who is doing the measuring and what information is available. Start by answering the five questions below.
- Do you have direct access to the FLW? Does the method require the ability to directly count, handle or weigh the FLW?
- What level of accuracy do you need? How accurate will the data gathered with this method be?
- What amount of time and resources can you assign to measuring FLW? The relative amount of resources (time, money, equipment) needed to carry out the method.
- Do you need a method that can tracks causes of FLW? Some methods can track causes associated with FLW and others cannot.
- Do you want to track progress over time? Some methods can assess increases or decreases in FLW across time to track progress.
Based on your needs and the answers to these questions, you can use Table 11 to determine which method or methods are most appropriate. If you are addressing multiple types of FLW (for example, both solid and liquid FLW), you may need to select multiple types of methods.
Table 11. Methods Used to Measure FLW in the Retail Sector
| Method Name | Direct FLW Access Needed? | Level of Accuracy? | Level of Resources Required? | Tracks Causes? | Tracks Progress Over Time? |
|---|---|---|---|---|---|
| Methods for gathering new data | |||||
| Direct Measurement | Yes | High | High | Yes | Yes |
| Waste Composition Analysis | Yes | High | High | No | Yes |
| Methods based on existing data | |||||
| Mass Balance | No | Medium | Low | No | Yes |
| Proxy Data | No | Low | Low | No | No |
| Records | No | Variable* | Low | No | Yes |
| Less commonly used methods at the retail sector | |||||
| Diaries | No | Low-Medium | Medium | Yes | Yes |
| Interviews/Surveys | No | Low-Medium | Medium-High | Yes | Yes |
*Accuracy depends on the type of record used: for example, waste transfer receipts may be highly accurate for determing FLW levels, whereas other records are less accurate.
Note: The methods named are nonexhaustive.
Source: Authors.
If you need additional guidance in selecting a method, the FLW Quantification Method Ranking Tool published by the Food Loss and Waste Protocol asks a series of 11 questions and provides a ranked list of methods based on your circumstances.
Case Study for the Retail Sector
Delhaize America, a food retailer, implemented a food waste measurement and reduction program in its East Coast stores and distribution centers. Through direct measurement with Scanner information and waste separation, Delhaize America is able to consistently track food waste over time. They have used this information to identify waste hotspots and to reduce FLW across their operations. For example, daily deliveries of fresh product (via computer-assisted ordering systems) has improved order accuracy and inventory management, greatly reducing the amount of produce that goes to waste. In some locations, staff noticed that more food was going to compost, which signaled a need for better coordination with local food banks to ensure that food safe for human consumption was not needlessly being composted rather than serving those in need. Such observations led to more food going to feed people and less food becoming waste.
Introduction
Food distributors and wholesalers ensure that food products make it to market and consumers. Distributors typically maintain exclusive buying agreements with producers, manufacturers and processors or provide products to a certain territory. They rarely sell goods directly to consumers but may work with wholesalers (or larger retailers) that buy in bulk. Wholesalers typically resell goods to retailers, while retailers resell goods directly to consumers.
Because they are subject to supply and demand fluctuations across the food supply chain, they must balance time sensitivity and cost in their operations. Variability within the distribution and wholesale sector can also affect FLW downstream, in the food service, retail and household stages.
In distribution and wholesale, FLW can be caused by damage and spoilage, lack of cold-chain infrastructure, delays during transport (e.g., border inspections), variable customer demands, modification or cancellation of orders, product specifications, variable cost of transport methods, inaccurate forecasting or purchasing, miscommunication with other entities further up and down the food supply chain, and many other factors.
As the specifics of this sector vary by country, so do the root causes behind the associated FLW. Thus generation and prevention of FLW differ from country to country and even from organization to organization, and interventions must be tailored to the context.
Some approaches to preventing FLW in distribution and wholesale are listed below.
- Work with actors upstream in the food supply chain to increase the share of second-grade products that are accepted and valorized to some point.
- Improve cold-chain management and infrastructure to prevent spoilage or degradation during storage and transport.
- Work with actors across the food supply chain to expand value-added processing to increase the proportion of produced food able to be consumed. This could include the creation of processes to valorize food that is damaged or deteriorates during transport and distribution.
- Adjust packaging to extend the life of food products and reduce damage during storage or transport.
- Rethink business models to maintain freshness and reduce shrink.
Methods Used to Measure FLW
Appropriate methods for FLW measurement depend on the context of who is doing the measuring and what information is available. Start by answering the five questions below.
- Do you have direct access to the FLW? Does the method require the ability to directly count, handle or weigh the FLW?
- What level of accuracy do you need? How accurate will the data gathered with this method be?
- What amount of time and resources can you assign to measuring FLW? The relative amount of resources (time, money, equipment) needed to carry out the method.
- Do you need a method that can tracks causes of FLW? Some methods can track causes associated with FLW and others cannot.
- Do you want to track progress over time? Some methods can assess increases or decreases in FLW across time to track progress.
Based on your needs and the answers to these questions, you can use Table 10 to determine which method or methods are most appropriate. If you are addressing multiple types of FLW (for example, both solid and liquid FLW), you may need to select multiple types of methods.
Table 10. Methods Used to Measure FLW in the Distribution and Wholesale Sector
| Method Name | Direct FLW Access Needed? | Level of Accuracy? | Level of Resources Required? | Tracks Causes? | Tracks Progress Over Time? |
|---|---|---|---|---|---|
| Methods for gathering new data | |||||
| Waste Composition Analysis | Yes | High | High | No | Yes |
| Methods based on existing data | |||||
| Mass Balance | No | Medium | Low | No | Yes |
| Proxy Data | No | Low | Low | No | No |
| Records | No | Variable* | Low | No | Yes |
| Less commonly used methods at the distribution and wholesale sector | |||||
| Diaries | No | Low-Medium | Medium | Yes | Yes |
| Direct Measurement | Yes | High | High | Yes | Yes |
| Interviews/Surveys | No | Low-Medium | Medium-High | Yes | Yes |
*Accuracy depends on the type of record used: for example, waste transfer receipts may be highly accurate for determing FLW levels, whereas other records are less accurate.
Note: The methods named are nonexhaustive.
Source: Authors.
If you need additional guidance in selecting a method, the FLW Quantification Method Ranking Tool published by the Food Loss and Waste Protocol asks a series of 11 questions and provides a ranked list of methods based on your circumstances.
Case Study for the Distribution and Wholesale Sector
The Mexican Transport Institute (Instituto Mexicano del Transporte–IMT) developed a methodology to identify cold-chain coverage and gaps across the country. The IMT uses a database with several metrics, including origin and destination of shipments, classification of loads, ownership of transportation units and cost of transportation. It monitors the status of the distribution and transportation system across Mexico alongside relevant costs, shipment data and records. This allows them to identify potential FLW hotspots and regions needing cold-chain management and infrastructure (Morales 2016, CEC 2017).
Introduction
The processing and manufacturing stage of the food supply chain encompasses all processes intended to transform raw food materials into products suitable for consumption, cooking or sale. In this guide, “food processing” and “food manufacturing” are used interchangeably. This stage in the supply chain includes the processes that turn raw agricultural products into saleable goods, which often move to retail, wholesale, distribution or food service institutions. It also includes packaging of processed goods.
Examples of organizations in this sector are: fruit and fruit juice processing plants, cereal manufacturing facilities, pastry factories, canneries, butchers, breweries, bakeries and dairy processing plants.
In processing and manufacturing, FLW can be caused by trimming for consistency, misshapen products, spillage, degradation during processing, production line changes, contamination, overproduction, order cancellation, changes in customer demand or specifications, or improper labeling, among other things.
Food processing represents 15–23 percent of the entire manufacturing industry (including nonfood manufacturing) in North America (USDA ERS 2016, Agriculture and Agri-Food Canada 2014, ProMéxico 2015).
Some approaches to preventing FLW in processing and manufacturing are listed below.
- Work with actors upstream in the food supply chain to increase the share of second-grade products that are accepted and valorized to some point.
- Improve cold-chain management and infrastructure to prevent spoilage or degradation during storage and transport.
- Work with actors across the food supply chain to expand value-added processing to increase the proportion of produced food able to be consumed.
- Standardize date labels to reduce the amount of FLW generated from confusion over food safety.
- Adjust packaging to extend the life of food products and reduce damage during storage or transport.
- Optimize manufacturing lines and production processes to increase yields and reduce inefficiencies.
Methods Used to Measure FLW
Appropriate methods for FLW measurement depend on the context of who is doing the measuring and what information is available. Start by answering the five questions below.
- Do you have direct access to the FLW? Does the method require the ability to directly count, handle or weigh the FLW?
- What level of accuracy do you need? How accurate will the data gathered with this method be?
- What amount of time and resources can you assign to measuring FLW? The relative amount of resources (time, money, equipment) needed to carry out the method.
- Do you need a method that can tracks causes of FLW? Some methods can track causes associated with FLW and others cannot.
- Do you want to track progress over time? Some methods can assess increases or decreases in FLW across time to track progress.
Based on your answers to these questions, use Table 9 to determine which method or methods are most appropriate. If you are addressing multiple types of FLW (for example, both solid and liquid), you may need multiple types of methods.
Table 9. Methods Used to Measure FLW in the Processing and Manufacturing Sector
| Method Name | Direct FLW Access Needed? | Level of Accuracy? | Level of Resources Required? | Tracks Causes? | Tracks Progress Over Time? |
|---|---|---|---|---|---|
| Methods for gathering new data | |||||
| Direct Measurement | Yes | High | High | Yes | Yes |
| Waste Composition Analysis | Yes | High | High | No | Yes |
| Methods based on existing data | |||||
| Mass Balance | No | Medium | Low | No | Yes |
| Records | No | Variable* | Low | No | Yes |
| Less commonly used methods at the processing and manufacturing sector | |||||
| Diaries | No | Low-Medium | Medium | Yes | Yes |
| Interviews/Surveys | No | Low-Medium | Medium-High | Yes | Yes |
| Proxy Data | No | Low | Low | No | No |
*Accuracy depends on the type of record used: for example, waste transfer receipts may be highly accurate for determing FLW levels, whereas other records are less accurate.
Note: The methods named are nonexhaustive.
Source: Authors.
For additional guidance, see the FLW Quantification Method Ranking Tool published by the Food Loss and Waste Protocol, which asks 11 questions about your circumstances and provides a ranked list of methods based on your answers.
Case Study for the Processing and Manufacturing Sector
Byblos Bakery is the top branded pita maker in western Canada. Working with Provision Coalition and Enviro-Stewards to measure and prevent FLW in their manufacturing operations Byblos saved over C$200,000. Enviro-Stewards conducted a food waste prevention assessment of the facilities, and the Provision Coalition’s FLW Toolkit was used to develop a set of FLW reduction strategies and solutions. By using a facility assessment along with the FLW Toolkit, Byblos could identify root causes for FLW generation and tailor interventions to their business. For example, improvements to retail inventory management helped minimize retail returns, and relatively small tweaks to the production process and facility immediately reduced waste in the factory. In total, Byblos reduced its food waste by 29 percent and saw an aggregate payback over 0.3 years (Provision Coalition 2017).
A significant amount of food grown for human consumption is never eaten. In fact, by weight, about one-third of all food produced in the world in 2009 was lost or wasted (FAO 2011). In North America, approximately 168 million tonnes of FLW are generated annually: 13 million in Canada, 28 million in Mexico and 126 million in the United States. This equates to 396 kilograms per capita in Canada, 249 in Mexico and 415 in the United States (CEC 2017).
This level of inefficiency suggests three strong incentives to reduce food loss and waste: economic, environmental and social.
Economic: The huge amounts of food lost or wasted are currently considered part of the cost of doing business as usual. Rather than trying to maximize the value of food produced, companies and other organizations tend to focus on the disposal costs for the products that are lost or wasted. Companies could make significant economic gains by putting food headed for the waste stream to profitable uses.
Environmental: When food is lost or wasted, all of the environmental inputs used on that food are wasted as well (FAO 2011). That means all the land, water, fertilizer, fuel and other resources that produced, processed or transported a food item are wasted when food meant to be consumed by people is thrown away. Food waste sent to landfills creates methane – a powerful greenhouse gas. Thus, reducing FLW can reduce a company’s environmental footprint.
Social: Surplus edible food can be redistributed to food banks, food rescue agencies and other charities, which can direct it to food insecure populations, making good use of the food rather than disposing of it. For many companies, food donation or redistribution is an important part of corporate social responsibility activities. Food directed to human consumption is not considered to be lost or wasted.
The old adage that “what gets measured gets managed” holds true with FLW. Measuring food waste helps an organization understand the root causes of food waste and thus work to prevent it.
The Risk of Not Changing
The business-as-usual path has risks. If a company continues to operate with built-in assumptions about acceptable levels of waste, it risks being surpassed by its more innovative competitors who can turn waste into profit. The business case for reducing FLW is strong, and those who ignore this opportunity will continue to waste money and resources. Additionally, an increasing number of local, subnational and national governments are imposing disposal bans on food waste or requiring excess food to be donated (Sustainable America 2017; Christian Science Monitor 2018). If this trend continues, companies may face increased expenses from further regulations in the future.
The Food Recovery Hierarchy
When trying to reduce FLW, the first emphasis should be on prevention, or source reduction. Although some end-of-life destinations for FLW have fewer negative impacts than others (e.g., FLW going to animal feed is preferable to FLW going to a landfill), prevention should be the foremost goal. This principle is reflected in the Food Recovery Hierarchy (Figure 1) developed by the United States Environmental Protection Agency (US EPA).
Figure 1. Food Recovery Hierarchy
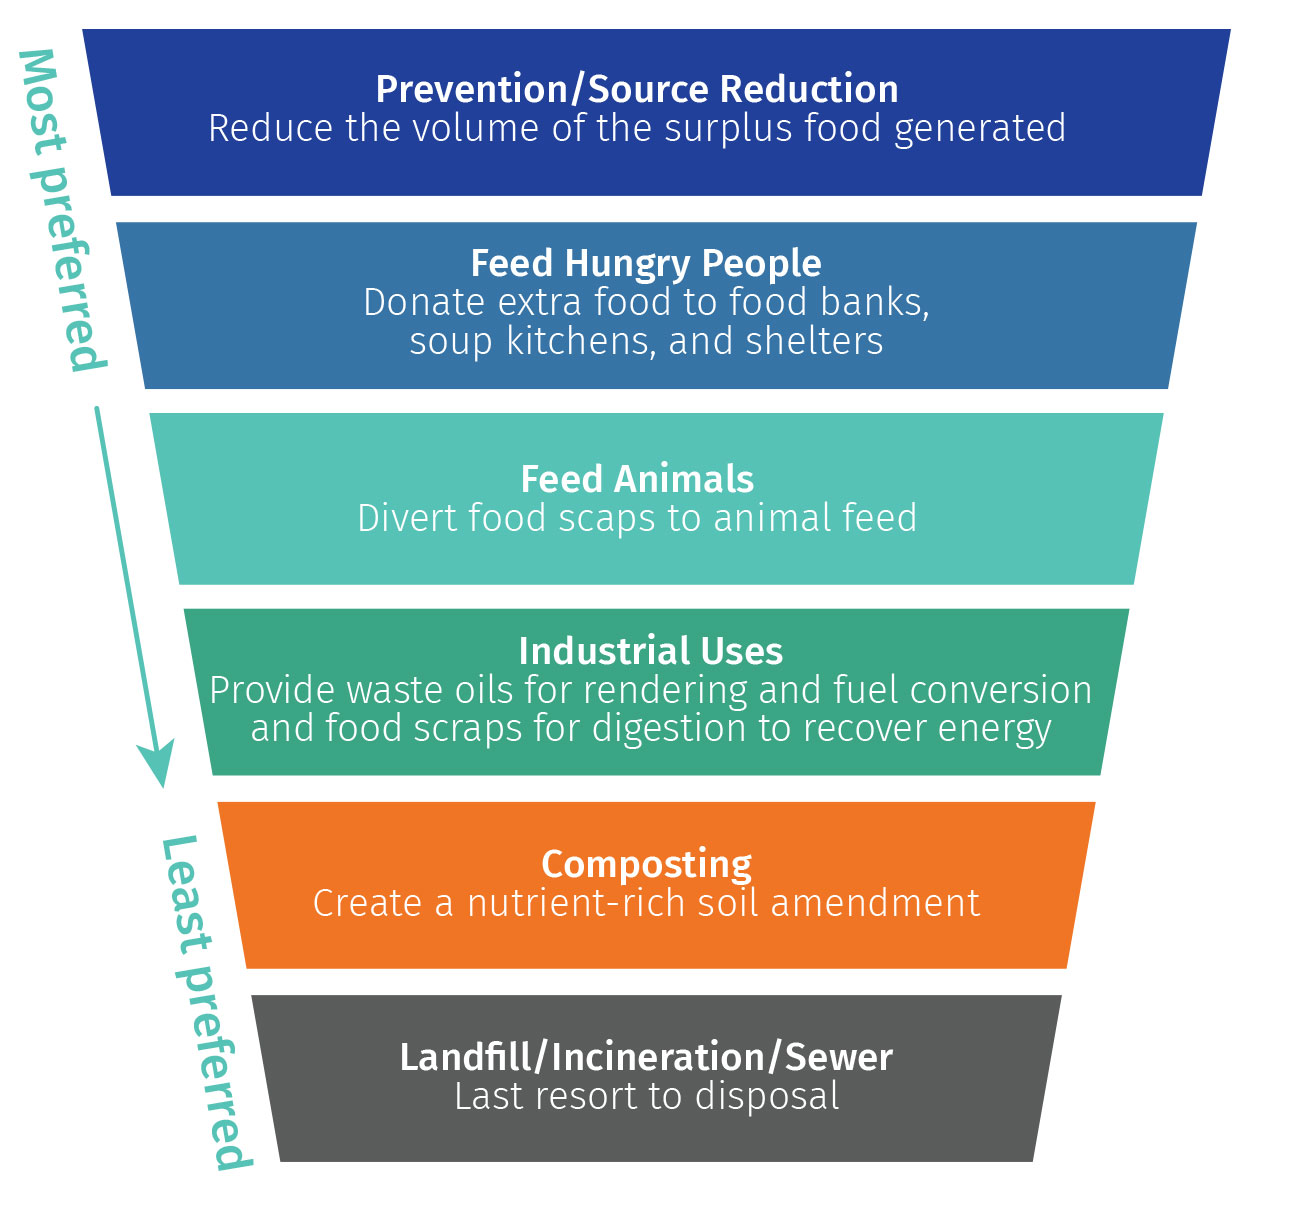
Source: Adapted from US EPA n.d.
Source reduction (i.e., preventing food waste in the first place) is the most desirable way to address FLW because it prevents the negative social, environmental and economic impacts of producing food that is wasted. Moving down the recovery hierarchy stages, less value is recovered from the FLW at each stage, until the bottom stage —landfill, incineration or sewer disposal—where negative environmental impacts are highest. From a climate perspective, tonne for tonne, preventing wasted food is six to seven times as beneficial as composting or anaerobic digestion of the waste (US EPA 2016).
Introduction
The primary production stage of the supply chain encompasses agricultural activities, aquaculture, fisheries and similar processes resulting in raw food materials. This first stage in the chain includes all activities related to the harvest, handling and storage of food products before they move to either processing or distribution. Any level of processing of raw food products does not fall within this stage of the supply chain but would rather be classified as processing and manufacturing.
Examples of primary production activities are: farming, fishing, livestock rearing and other production methods.
Food losses in primary production can be caused by many factors, including but not limited to: pests or adverse meteorological phenomena, damage incurred during harvest, lack of proper storage infrastructure, cosmetic or size requirements or economic or market variability (i.e., cancellation of orders, rigid contract terms, price variability or high labor costs).
The following nonexhaustive, illustrative list shows ways to prevent FLW during primary production.
- Work with actors downstream in the food supply chain to increase the share of second-grade products that are accepted and valorized to some point.
- Improve cold-chain management and infrastructure to prevent spoilage or degradation during storage and transport.
- Work with actors downstream in the food supply chain to expand value-added processing to increase the proportion of produced food able to eventually be consumed.
Methods Used to Measure FLW
Appropriate methods for FLW measurement depend on the context of who is doing the measuring and what information is available. Start by answering the five questions below.
- Do you have direct access to the FLW? Does the method require the ability to directly count, handle or weigh the FLW?
- What level of accuracy do you need? How accurate will the data gathered with this method be?
- What amount of time and resources can you assign to measuring FLW? The relative amount of resources (time, money, equipment) needed to carry out the method.
- Do you need a method that can tracks causes of FLW? Some methods can track causes associated with FLW and others cannot.
- Do you want to track progress over time? Some methods can assess increases or decreases in FLW across time to track progress.
Based on the answers to these questions, use Table 8 to determine which method or methods are most appropriate. If you are addressing multiple types of FLW (for example, both solid and liquid FLW), you may need to select several methods.
Table 8. How Some Methods to Measure Production Sector FLW Rank according to the Five Questions
| Method Name | Direct FLW Access Needed? | Level of Accuracy? | Level of Resources Required? | Tracks Causes? | Tracks Progress over Time? |
|---|---|---|---|---|---|
| Commonly used methods for gathering new data | |||||
| Direct Measurement | Yes | High | High | Yes | Yes |
| Interviews/Surveys | No | Low-Medium | Medium-High | Yes | Yes |
| Commonly used methods based on existing data | |||||
| Proxy Data | No | Low | Low | No | No |
| Records | No | Variable* | Low | No | Yes |
| Less commonly used methods at the production sector | |||||
| Diaries | No | Low-Medium | Medium | Yes | Yes |
| Mass Balance | No | Medium | Low | No | Yes |
| Waste Composition Analysis | Yes | High | High | No | Yes |
*Accuracy depends on the type of record used: for example, waste transfer receipts may be highly accurate for determing FLW levels, whereas other records are less accurate.
Note: The methods named are nonexhaustive.
Source: Authors.
For additional guidance in selecting a method, see the FLW Quantification Method Ranking Tool published by the Food Loss and Waste Protocol, which asks 11 questions about your circumstances and provides a ranked list of methods based on your answers.
Case Study for the Primary Production Sector
In the US state of California, the World Wildlife Fund (WWF) collected baseline primary data and supported measurement of post-harvest losses of several crops. The data were quantitative and qualitative data and they performed subsequent analyses to identify root causes of farm-level losses. They also calculated environmental impacts to illustrate the resource intensity of various crops and the associated impacts of any related FLW. Such a holistic measurement approach and conversion into other metrics helped identify the scale of FLW, identify root causes and find opportunities for interventions.
For example, during the 2017–18 growing season, the average measured losses at harvest on the farms sampled were 40 percent of fresh tomatoes, 39 percent of fresh peaches, 2 percent of processing potatoes and 56 percent of fresh romaine lettuce. Qualitative results highlighted the difficulties farmers face when balancing large yields and fixed contracts, as well as meeting strict product quality standards. WWF recommended further research into whole-farm purchasing contracts for specialty crops, flexible quality/visual standards and further valorization of preserved products to account for overproduction (WWF 2018).
Food loss and waste (FLW) is an increasingly important issue in North America, where annually close to 170 million tonnes of food produced for human consumption are lost and wasted across the food supply chain. Food waste in landfills is a significant source of methane gas—a greenhouse gas (GHG) 25 times stronger than carbon dioxide. FLW also has environmental and socio-economic impacts, including: the inefficient use of natural resources, economic loss, biodiversity loss, and public health issues.