Proxy data from a similar geographic area, company, facility and/or time can be used in place of data from the unit being studied if there are no resources for conducting a full study or if data gaps exist in actual data. For example, data from another company could be used to fill in gaps in an inventory, data from one factory could approximate the level of food loss and waste in another, or household data from another city could be used to assess household waste (either per person or in total). However, proxy data cannot be used to track progress over time.
A summary of the strengths and limitations of proxy data is shown in Table A14.
Table A14. Factors to Consider when Using Proxy Data to Quantify FLW
| Strengths | Limitations / Points to Consider |
|---|---|
|
|
Source: Authors.
How to Use Proxy Data to Quantify FLW
Step 1: Determine what data is needed
Proxy data is useful for filling identified gaps in an inventory. If a company wants to quantify its food loss and waste levels but cannot conduct its own measurements, it may use public data from another company in the same sector to approximate its own. Similarly, if a country is conducting a national food loss and waste assessment, it may look to a geographically similar country that has published data to estimate its own FLW levels.
Step 2: Determine available proxy data
Proxy data can be drawn from a range of sources. Databases such as the Food Waste Atlas and FAOSTAT compile data, allowing users to search to find the most useful proxy data for their needs. A simple Internet search should also help to identify potentially relevant sources of data.
Step 3: Select the data to use
Select the proxy data that is most similar to the inventory being approximated. Variations in geography, company, facility, timeframe and other factors can introduce uncertainty and result in a final number that is less accurate. If possible, inspect the methodology used to collect the proxy data to determine how the number was derived and how reliable it is.
Step 4: Prepare and Analyze the Data
The proxy data must be transformed into a factor that can be applied to the data gap in the quantification being undertaken. Depending on the sector, this factor could be something like FLW per employee or FLW per metric tonne of food processed by a facility. This factor can then be applied to the population or facility being studied to determine the approximated FLW level.
Common Data Challenges in Using Proxy Data
Inaccurate data. Although proxy data can help to estimate FLW levels, using data from other contexts will rarely be as accurate as performing a direct measurement study. For this reason, proxy data should be a last resort when a lack of resources or expertise prevents use of another method.
Lack of available data. Many public sources of FLW exist, but there may be instances where no similar data sources can be found for a given sector, geography or food type. In these cases, consider contacting companies or researchers in the sector or geography in question to see if they can share any nonpublic data.
Inability to track changes in FLW over time. Since proxy data approximates FLW in a different context than your own, it cannot be used to track FLW changes over time. This is because any change in FLW levels would be reflective of a change in the other context, not in the facility or geography being studied. For this reason, proxy data should be seen as a starting point before moving into more specific measurement methods as a company or facility becomes more active in reducing FLW.
Additional Resources for Using Proxy Data
FLW Protocol. 2016. Chapter 10. “Proxy Data.” In Guidance on FLW quantification methods. <http://flwprotocol.org/wp-content/uploads/2016/06/FLW_Guidance_Chapter10_Proxy_Data.pdf>.
WRAP and World Resourcs Institute. 2018 Food Loss and Waste Atlas. <https://thefoodwasteatlas.org/>.
FAOSTAT. “Food and agricultural data.” Database. Food and Agriculture Organizaiton of the United Nations. <www.fao.org/faostat/en/#home>.
Mass balance measurement infers food loss and waste levels by comparing inputs (e.g., products entering a grocery store) with outputs (e.g., products sold to customers) along with changes in standing stock levels. At its most basic, this method estimates FLW by subtracting the outputs from the inputs, with the difference being considered the amount of FLW.
A summary of the strengths and limitations of mass balance measurement is shown in Table A13.
Table A13. Factors to Consider when Using Mass Balance to Quantify FLW
| Strengths | Limitations / Points to Consider |
|---|---|
|
|
Source: Authors.
How to Use Mass Balance for FLW Quantification
Step 1: Define your inputs, outputs and stocks
Three key figures – the inputs, the outputs and the stocks – form the basis of the mass balance calculation.
In a manufacturing plant, the inputs would be the ingredients used, the outputs would be the products produced and the stocks would be whatever ingredients or products are held on site. At a state or country level, the inputs would be domestic food production and imports, and the outputs would be food consumption, exports and nonfood uses such as seed, feed, fuel and pet food.
Step 2: Identify data sources
After determining the inputs, outputs and stocks, find appropriate sources of data to estimate those numbers. Data can come from sources such as product inventories, shipping and storage records, invoices and other documentation. See the “Records” section above for more information on gathering records.
Once the data sources have been identified, make sure that all data is in the same units. If it is not, you will need to standardize the units.
Step 3: Account for any variations
If the weight of the inputs changes during processing or cooking, you will need to adjust for it in the mass balance equation. For example, in some cooking processes (e.g., preparing a sauce), significant amounts of water will evaporate, while in others (e.g., cooking pasta), water will be added. These weight changes must be identified so they do not skew the overall waste figure.
Step 4: Perform the mass balance analysis
Once the data have been collected and standardized, conduct the mass balance analysis. The calculation is based on the following equation (FLW Protocol 2016a):
FLW = Inputs – Outputs ± Changes in Stock ± Adjustments
The terms in this equation are defined as follows:
Inputs: the ingredients or food products that enter the facility or geographic region during the measurement timeframe.
Outputs: the ingredients or food products that leave the facility or geographic region during the measurement timeframe.
Changes in stock: any variation, positive or negative, in the amount of ingredients or food products held by the facility or geographic region during the measurement timeframe.
Adjustments: any change in weight, positive or negative, to the ingredients or food products, most commonly due to added or removed water.
The result of this equation is an estimate of the FLW level, since the unexplained variation between inputs and outputs can be inferred to be due to loss and waste.
Common Data Challenges when Using Mass Balance
Inaccuracies in data. If any of the four key variables in a mass balance equation are inaccurate, the final FLW number will also be inaccurate. Therefore, it is crucial to make sure these data are accurate and to note any points of uncertainty when reporting the final FLW figure.
Additional Resources on Using Mass Balance
FLW Protocol. 2016. Chapter 8. “Mass Balance.” In Guidance on FLW quantification methods. <http://flwprotocol.org/wp-content/uploads/2016/06/FLW_Guidance_Chapter8_Mass_Balance.pdf>.
TU Wein. n.d. Stan2Web. Vienna, Austria: Technische Universitat Wien. <http://www.stan2web.net>. (STAN [short for subSTance flow Analysis] is a free software for conducting a mass balance measurement.)
Interviews and surveys (hereafter surveys) can be a cost-effective way to develop rough quantitative estimates of FLW and to gather information about its causes. Surveys can also help collect information from a wide array of individuals or entities on attitudes toward food waste.
Surveys can be grouped into two categories: those used to collate existing data and those used to generate new FLW estimates.
A summary of the strengths and limitations of the two different types of surveys is shown in Tables A10 and A11.
Table A10. Factors to Consider when Using a Survey to Collate Existing Data
| Strengths | Limitations / Points to Consider |
|---|---|
|
|
Source: Authors.
Table A11. Factors to Consider when Using a Survey to Generate New Data
| Strengths | Limitations / Points to Consider |
|---|---|
|
|
Source: Authors.
How to Conduct a Survey to Quantify FLW
This section describes seven steps to conduct a survey to gather information about FLW.
Step 1: Set hypotheses and determine the survey approach
Before starting a survey, have a hypothesis in mind for the results you expect from the survey. This hypothesis will help focus the research and establish goals. An example of a hypothesis is: “We expect that corn farmers will report that 30 percent of their crop is left in the field during harvest.” This simple hypothesis identifies the type of crop (corn), the intended respondent (farmers) and what is being measured (crop left in field during harvest).
Next, determine which type of survey to use. If the respondents are likely to have already collected data of their own, you can use a survey focused on collating existing data. If the survey asks respondents to contribute or quantify new FLW data, a survey focused on quantifying is needed.
Step 2: Identify the method by which the survey will be administered
Surveys can be administered by mail, by telephone, electronically or in-person. Each method has advantages and disadvantages, as seen in Table A12.
Table A12. Advantages and Disadvantages of Methods for Conducting Surveys
| Method | Advantages | Disadvantages |
|---|---|---|
| By mail | Relatively low cost Allows for both visual and written prompts |
Impractical if mail service is limited Low response rate |
| Telephone | Interviewer can administer survey directly and explain any unclear questions Reduces travel costs as compared to in-person method |
No visuals can be shared Limits respondents to those with telephone access Can be difficult to schedule |
| Electronic | Low cost Wide reach |
Limits respondents to those with technological capability |
| In-person | Interviewer can administer survey directly and explain any unclear questions | More costly in terms of time and expense Interviewer can unconsciously bias responses Can be difficult to schedule |
Source: Authors.
Step 3: Identify respondent audience
In some cases, the participant audience for a survey-based study will be a discreet group. For surveys with a large number of target respondents, a random sample may need to be developed. If so, a professional statistician should be consulted, although simple random sampling can be conducted if a list of the members of a population is available and complete (Laerd 2012).
Step 4: Prepare questions to quantify FLW
The next step is to develop the questionnaire to be distributed for the survey.
Some common topics for questions in an FLW quantification survey are (CEC 2017):
- estimates of FLW generated;
- reasons or causes for FLW;
- how FLW is managed; and
- current strategies or suggestions on how to prevent or reduce FLW.
You might also want to collect income or livelihood data on the respondents to cross reference some of the answers.
Questions should be sequenced in a logical progression, with simpler or more important questions at the beginning, since respondents frequently fail to complete the entire surveys (Statpac 2017). If a survey is too long it may be off-putting to respondents, so each question should be evaluated for its importance to the study.
A further discussion of the benefits and drawbacks of a number of types of questions can be found in section 7.2 of the “Guidance on Surveys” developed by the FLW Protocol.
Step 5: Test the survey and revise
If possible, test the survey with a subset of the target audience to provide insight into questions that may be confusing or unclear for the respondent. The survey can then be revised to address these concerns.
Step 6: Administer the survey
Once the survey has been designed and tested, it can be distributed to the intended audience of respondents. A complete list of the survey recipients should be kept along with those who have responded in order to track response rates.
Step 7: Prepare and analyze the data
After responses are received, they must be standardized and collated. The simplest method for doing this is to enter the data into an electronic spreadsheet.
Points to highlight in a summary of an FLW survey are:
- Frequency and amount of FLW;
- Reasons for different types of FLW;
- Relationship between FLW and variables (such as income and location); and
- Strategies used and suggestions to address or reduce FLW.
Common Data Challenges in Conducting a Survey
Low response rates. Because surveys require respondents to take time from their schedules to complete, many suffer from low response rates. For example, a survey from Food and Consumer Products of Canada in 2015 to collect FLW data from companies had just a 35 percent response rate (Food and Consumer Products of Canada 2015). Although it can be difficult to boost response rates, a common strategy is to provide respondents with a benefit for participating, such as compensation (usually quite small) or a promise of sharing the survey results (Statpac 2017).
Concerns over confidentiality. Companies are understandably reluctant to share information that could affect their competitive advantage. This can be addressed by reporting information from an entire sector rather than identifying data from individual companies. This requires the company to trust the entity conducting the survey to keep the information confidential.
Underreporting. Respondents may underreport FLW because they don’t want to appear wasteful or because they lack awareness around FLW. To counteract these biases, clear instructions should be given on the importance of accurate responses and that the survey administrators are not seeking to “shame” participants over their FLW. Survey results can also be cross-referenced with the findings of other quantification methods (such as a waste composition analysis) to determine the extent of underreporting.
Additional Resources on Conducting a Survey
FLW Protocol. 2016. Chapter 7. “Guidance on surveys,” in Guidance on FLW quantification methods. < http://flwprotocol.org/wp-content/uploads/2016/06/FLW_Guidance_Chapter7_Surveys.pdf >.
David S. Walonick. 2012. “Steps in designing a survey.” StatPac. < www.statpac.com/survey-design-guidelines.htm >.
Direct measurement includes a variety of methods in which FLW is directly counted, weighed or otherwise measured as it occurs. Direct measurement often produces the most accurate FLW figures but can also require the most expertise, time and cost. These methods vary based on the stage of the supply chain thus are organized here by sector.
A summary of the strengths and limitations of direct measurement is shown in Table A3.
Table A3. Factors to Consider When Using Direct Measurement to Quantify FLW
| Strengths | Limitations / Points to Consider |
|---|---|
|
|
Source: Authors.
Using Direct Measurement to Quantify FLW in Primary Production
A common direct measurement approach at the production stage is to take random samples from the crop or product being produced to determine levels of FLW.
An example is described in a toolkit to help farmers to assess the amount of marketable produce remaining in their fields after harvest to help prevent in-field losses of crops (Johnson 2018). The method involves a one-off assessment of the crop in a sample area of a field, involving six steps:
- Note the row spacing, number of rows and the acreage of the field. Gather equipment.
- Select and mark rows randomly.
- Harvest the rows.
- Sort samples into categories.
- Weigh and record samples in each category.
- Extrapolate the data from the selected rows to the entire field and calculate an estimate of the potential in the field.
The toolkit suggests three categories for sorting: marketable (i.e., high-quality appearance), edible (i.e., cannot meet highest buying specification but still edible) and inedible. The categories can be adapted to further sort the inedible items according to the reasons why they are inedible (e.g., insect damage, disease, decay, over-maturity). This additional stage can help farmers identify the root causes leading to items being unsuitable for harvest and suggest other markets where it might be sold.
A summary of the strengths and limitations of on-farm data collection is shown in Table A4.
Table A4. Factors to Consider When Using Direct Measurement to Quantify FLW in Primary Production
| Strengths | Limitations / Points to Consider |
|---|---|
|
|
Source: Authors.
Using Direct Measurement to Quantify FLW in Processing and Manufacturing
How to measure material flows in manufacturing and processing facilities is explained in many toolkits aimed at identifying and tackling food loss and waste. For instance, the Provision Coalition’s Food Loss and Waste Toolkit based on Enviro-Stewards’ approach offers guidance on direct measurement of FLW in manufacturing and processing facilities. The details must be tailored to the situation, but it usually involves diverting the food that is being lost or wasted into containers (e.g., buckets) where it can be weighed. Food waste is collected for a period of time (e.g., one eight-hour shift) and then scaled up to provide an approximate estimate the amount for a week, month or year. More accurate estimates require repeated sampling to account for fluctuations over time (e.g., seasonality).
The tool was designed for Canadian users. The financial and nutritional calculations would be accurate for other users but some of the environmental information uses factors (e.g., carbon factors) specific to Canadian provinces thus would not be entirely accurate for other countries.
A summary of the strengths and limitations of direct measurement in processing and manufacturing is shown in Table A5.
Table A5. Factors to Consider When Using Direct Measurement to Quantify FLW in Processing and Manufacturing
| Strengths | Limitations / Points to Consider |
|---|---|
|
|
Source: Authors.
Using Direct Measurement to Quantify FLW in Distribution and Wholesale
Direct measurement is frequently not possible at the distribution and wholesale stage due to the transient nature of the sector. However, most distributors and wholesalers possess information on purchases, inventory and sales. This measurement approach compares inputs (purchases) with outputs (sales) alongside changes in stock levels. It can estimate the value of lost sales and can provide a good starting point for prioritizing action for preventing food from being wasted. The “Mass Balance” module below gives more detail about using this approach to approximate FLW.
Using Direct Measurement to Quantify FLW in Retail
A common direct measurement approach at the retail sector is electronic scanning.
Most retailers use an electronic scanning system for inventory and sales. Under this method, when items leave the retailer’s premises for reasons other than being sold (e.g., landfill, donation), they are scanned, and this information is integrated into a database. This database can then be used to quantify the amounts and types of food going to different destinations. It can be used to estimate the value of lost sales and can provide a good starting point for prioritizing action to prevent food from being wasted. However, fresh produce, bakery and delicatessen items are often challenging to capture since they are often not consistently scanned out.
A summary of the strengths and limitations of scanning in retail is shown in Table A6.
Table A6. Factors to Consider when Using Scanning for FLW Quantification in Retail
| Strengths | Limitations / Points to Consider |
|---|---|
|
|
Source: Authors.
Using Direct Measurement to Quantify FLW in Food Service and Institutions
Smart bins and plate weighing are commonly used to measure FLW in the food service sector.
A smart bin is a disposal container attached to a data entry system. The smart bin weighs items as they are added. It also has a terminal for the user to enter details of the type of food being wasted and the reason for it being wasted. This information is passed to a database that can be analyzed to provide information for preventing food waste (or diverting it up the waste hierarchy). It can also be linked to procurement systems to provide financial information. Smart bins can be deployed as a one-off project to facilitate change or provide on-going monitoring for continuous improvement and measurement of performance data. Numerous smart bin providers can be found through an Internet search.
A summary of the strengths and limitations of smart bins can be found in Table A7.
Table A7. Factors to Consider when Using Smart Bins
| Strengths | Limitations / Points to Consider |
|---|---|
|
|
Source: Authors.
Plate weighing can be used to measure plate leftovers in hospitality, food service and school settings. It usually involves two direct measurements:
- a sample of trays containing the food directly after serving to establish the average amount being served; and
- a sample of trays containing the plate leftovers after the diners have eaten.
The amount of plate waste is usually expressed as a percentage of these two quantities.
A summary of the strengths and limitations of plate weighing is shown in Table A8.
Table A8. Factors to Consider when Using Plate Weighing
| Strengths | Limitations / Points to Consider |
|---|---|
|
|
Source: Authors.
Using Direct Measurement to Quantify FLW in Households
Scales or measurement containers can be used in households to weigh or measure FLW directly. However, it is contingent on the members of the household to correctly sort the FLW, which may lead to underreporting. More information about how households can measure their own FLW can be found in the “Diaries” section above.
A summary of the strengths and limitations of household caddies is shown in Table A9.
Table A9. Factors to Consider when Measuring Household FLW
| Strengths | Limitations / Points to Consider |
|---|---|
|
|
Source: Authors.
Using Direct Measurement to Quantify FLW in the Whole Supply Chain Approach
Although measuring FLW directly across multiple sectors is challenging, it is possible to conduct direct measurements of separate sectors and then combine those sectoral measurements to reach a total across sectors. In these cases, the following concerns must be considered:
- The scope of what is considered FLW must be identical across the sectoral studies.
- Ideally, the same method of measurement is used. If this is not possible, the different methods should be reported.
- The FLW being measured must not be double-counted across sectors. This can be accomplished by delineating the sectors in advance.
In the context of FLW, diaries refer to the practice of a person or group of people (e.g., the residents of a household) keeping a log of food loss and waste that occurs within their home or other unit. The diary usually calls for the participant to log the amount and type of food being lost or wasted, along with how and why the FLW was discarded.
Diaries can take many forms, such as a paper-based diary, an electronic diary or even a photographic diary in which participants take pictures of their food waste for further analysis.
A summary of the strengths and limitations of diaries is shown in Table A1.
Table A1. Factors to Consider When Using Diaries to Quantify FLW
| Strengths | Limitations / Points to Consider |
|---|---|
| Provides information on the types of food wasted and the reasons behind that waste
Can gather data on otherwise difficult-to-measure material flows (e.g., food waste going into the sewer or at-home composting) |
Can be relatively expensive, especially if diary participants are given an incentive
Can underestimate the amount of waste due to aspirational biases Can be coupled with interviews or ethnographic methods to further understand why food gets wasted |
Source: Authors.
How to Use Diaries to Quantify FLW
This module provides an overview of the steps that should be undertaken to use diaries to gather information about FLW. Although these broad steps will apply to most cases, a professional statistician or researcher can further tailor the design of a diary to best meet the needs of a given situation.
Step 1: Decide how participants will quantify FLW and for how long
In a diary study, participants can quantify FLW by weighing, measuring the volume or approximating FLW. Of these methods, weighing produces the most precise data, but it is also the most time-intensive for the participant and may be expensive, since participants might be given a scale.
In determining the length of the study, consider the trade-off between a longer, more intensive diary period that will produce more data and the burden that it imposes on participants, who may be more likely to drop out of the study.
Step 2: Identify how the diaries will be administered
Diaries can be administered in print by mail or electronically via a computer or smartphone app. Each method has advantages and disadvantages as shown in Table A2.
Table A2. Advantages, Disadvantages and Examples of Diary Types
| Method | Advantages | Disadvantages | Example |
|---|---|---|---|
|
|
See this sample print food waste diary (WRAP 2012a). | |
| Electronic |
|
|
See this sample food waste tracking spreadsheet (OpenIDEO n.d. ) |
| Smartphone app |
|
|
The app “SmartIntake” is one example of a food waste tracking app—it allows pictures to be taken before and after a meal and then sent to the researcher |
Source: Authors.
Step 3: Identify respondent audience
In some cases, the participants in a diary study will be a discreet group. For surveys with a larger population of target respondents, a random sample may need to be developed, in which case a professional statistician should be consulted, although simple random sampling can be conducted when a list of the members of a population is available and complete (Laerd 2012).
Step 4: Recruit participants
Participants in a diary study must be selected from the group being studied. Because keeping an FLW diary is a time-intensive commitment for participants, some sort of incentive may be necessary.
Step 5: Prepare questions to quantify FLW
An effective FLW diary will provide fields for categories of data. Some common fields are:
- Food type (e.g., carrot, ham sandwich, chicken)
- Material type (i.e., food and/or inedible parts)
- How it was purchased (e.g., fresh, frozen, canned)
- How much was wasted (provide unit of measure)
- Why it was wasted (e.g., cooked badly, served too much, spoiled)
- Disposal method (e.g., compost, garbage disposal, pet food)
It is best to include all the above information to form the most complete FLW inventory, although the diary should be tested to ensure that the burden is not too great on the participants.
Step 6: Test the diary and revise
Testing the diary with a small subset of the target audience can provide insight into which questions may be confusing, burdensome or unclear. The survey can then be revised to address the concerns of the testers.
Step 7: Administer the diary
Once the survey has been designed and tested, it can be distributed to the intended respondents. Keep a complete list of survey recipients along with those who respond to track response rates.
Step 8: Prepare and analyze the data
Responses must be standardized and collated. The simplest method is to enter the data into a spreadsheet. If the diary contained open-ended questions, determine whether to enter the response in full or to code the responses into categories. If the diary contained measurements of volume or approximations, convert these measurements to weight using a predetermined conversion factor.
Common Data Challenges in Using a Diary
Underreporting. Both the social desirability bias and “diary fatigue” may lead participants to underreport their FLW. This can be pre-empted with clear instructions about accurate diary-keeping and a reminder that the diary process is not seeking to shame participants over their FLW amounts. Diary results can also be cross-referenced with the findings of other quantification methods (e.g., a waste composition analysis) to determine the extent of underreporting.
Low response rates. Because diary studies are generally voluntary and require the respondent to take time out of their schedules to complete, many have low response rates. A common strategy to boost response rates is to provide an incentive to the respondent. In addition to a monetary incentive, participants may be permitted to keep scales or any other any equipment distributed for FLW quantification purposes.
Additional Resources for Diaries
FLW Protocol. 2016. Chapter 6, “Diaries,” in Guidance on FLW quantification methods. <http://flwprotocol.org/wp-content/uploads/2016/06/FLW_Guidance_Chapter6_Diaries.pdf>.
OpenIDEO. n.d. “Food waste challenge: Keeping a food waste diary.” <https://challenges.openideo.com/content/food-waste-diary>.
WRAP. 2012a. “Your household’s food and drink waste diary.”
The following pages contain guidance for different sectors of the food supply chain on how to measure food loss and waste. Each section contains a short description of the sector and guidance on how to select the most appropriate measurement method for it, as well as a case study of how a company in that sector measured (or could measure) FLW. You can review the most relevant sector or sectors.
The sectors are:
Measuring FLW should go beyond simply measuring the amount of food that leaves the food supply chain. This measurement fails to capture the impacts and benefits of reducing and preventing FLW. Preventing FLW has far-reaching economic, environmental and social benefits that can also be tracked.
Which Impacts Should I Track?
Key performance indicators can determine an organization’s success in achieving an objective or evaluating activities. Using a well-chosen suite of metrics, organizations can find out if they are achieving FLW prevention, redistribution or diversion. These metrics can also evaluate progress and tailor future interventions. Possible impacts fall into three broad categories:
- environmental impacts;
- financial impacts; and
- social impacts.
Organizations can monitor progress (and communicate success) more effectively if they use a range of appropriate metrics and consider reporting results in all three categories.
Environmental Impacts
Food production and all its associated processes (including processing, manufacturing, packaging, distribution, refrigeration and cooking) require resources, such as arable and pasture land, fresh water, fuel and chemical inputs (e.g., fertilizer, herbicides and pesticides), and cause environmental impacts, such as air and water pollution, soil erosion, emissions of greenhouse gases and biodiversity loss.
Depending on its management, FLW can cause additional environmental impacts that would not have occurred had the food been consumed. Some of these are associated with transportation of waste, land uses for landfills and methane emissions from landfills. While less important than impacts associated with production, these impacts can still be significant.
Examples of environmental impacts that an entity could track alongside FLW data are: greenhouse gas emissions, use of water, land, fertilizers and energy and biodiversity loss.
Greenhouse Gas Emissions
Greenhouse gas (GHG) emissions are the most commonly tracked environmental impact related to FLW. For most food products, the GHGs can be determined by a lifecycle analysis (LCA), which provides a full picture of the GHGs associated with the production of a food item from the point of production to the point at which it is lost or wasted. Each food item has a unique set of GHG factors depending on the land and resources needed to produce it. The GHG impact factors increase the further along the supply chain FLW is generated.
Much LCA data is publicly available. The sources below provide GHG impact factors.
- Individual product LCA studies, found via search engine
- Commercial databases such as Ecoinvent, GaBi, FoodCarbonScopeData, World Food LCA Database (Quantis) and Agri-Footprint (Blonk Consultants)
- US Department of Agriculture (USDA) Life Cycle Assessment Commons
The US EPA Waste Reduction Model (WARM) can help to assess the GHGs associated with FLW. WARM provides estimates of GHG emissions associated with baseline and alternative waste management practices, including source reduction, recycling, anaerobic digestion, combustion, composting and landfilling.
Water Use
Water is used throughout the food supply chain, including to water crops, in manufacturing processes and to wash food waste down the drain to a sewer. Three types of water can be considered when assessing environmental impacts (Hoekstra et al. 2011):
- Blue water – water withdrawn from ground or surface water sources (e.g., irrigation water)
- Grey water – the water required to dilute polluted water for it to be safely returned into the environment
- Green water – water evaporated from soil moisture (e.g., rainfall)
Most estimates of environmental impacts include only blue water and grey water, although green water is relevant in water-scarce regions.
The largest database of water impacts is from the Water Footprint Network, with the Water Footprint Assessment Tool being especially useful (Water Footprint Network 2018). When using the tool, select “Production Asssessment” and select the commodity of interest as well as its country of origin to access the data of interest. The Water Footprint Network also provides country-specific blue, grey and green impact factors for crop and animal products.
Although GHGs and water are the most common environmental impacts measured in association with FLW, several others are relevant. Because these impacts are less frequently quantified, they have fewer measurement resources.
Land Use
The impact on land use is more complicated to measure than the impact on GHGs or water. Some complicating factors are multiple cropping (where multiple crops are harvested from the same land within the course of a year) and crops that have multiple-year cycles, such as sugarcane. No simple, easily available tools yet exist to calculate land use associated with FLW but the Food and Agriculture Organization of the United Nations (FAO) Food Wastage Footprint provides global estimates of land used for food that is lost or wasted, as well as the relative impacts of a range of commodity types (FAO 2015).
Fertilizer Use
At the production level, fertilizer use associated with food loss or waste can be roughly estimated by multiplying the percentage of FLW by the total amount of fertilizer used. However, no simple method exists for other stages of the supply chain where the total fertilizer input may not be known. One study has estimated fertilizer loss at the country level using data from the FAO database, FAOSTAT (Kummu et al. 2012, FAO n.d.).
Energy Use
Most environmental impact estimates do not break out energy use from GHG estimates, but one US study found that energy embedded in wasted food represented about 2 percent of the country’s annual energy use (Cuellar and Webber 2010). The Provision Coalition’s Food Loss and Waste Toolkit based on Enviro-Stewards’ approach may help companies assess energy use relating to FLW.
Biodiversity Loss
Biodiversity loss associated with FLW is an emerging topic. Food production is the leading driver of biodiversity loss through conversion of natural habitats to farmland, intensification of farming, pollution and, in the case of fish, over-exploitation (Rockstrom et al. 2009). Some of this biodiversity loss occurs to produce food that is wasted. At the time of publication, no simple resources existed to assist in assessing potential biodiversity loss. However, tools may by developed in the future.
Financial Impacts
Most of the financial impacts of FLW are associated with disposal, however the total cost of FLW includes all resource inputs wasted along with the food. Simply focusing on disposal costs overlooks the vast majority of financial opportunities and benefits of preventing FLW. Quantifying the costs of FLW might typically involve assessing the following items:
- The purchasing costs of the incoming food and/or ingredients;
- The costs added to the food within the business (e.g., relating to labor and utilities,); and
- The costs associated with redistribution of surplus food or the disposal and treatment of FLW.
Financial impacts that can be tracked alongside FLW data include the following examples:
- The value of the food that was lost or wasted;
- The cost of FLW as a percentage of food sales; and
- The cost and benefits of investment in a food-waste-reduction program.
Two direct measurement tools can capture the weight of FLW and translate it into dollar values: smart scales in the food service sector (e.g., LeanPath or Winnow tools) and the Provision Coalition’s Food Loss and Waste Toolkit for manufacturers.
Social Impacts
Social impacts refer to the effects of FLW on humans. Examples of trackable social impacts are the value of the donated food, the nutritional content and meals wasted.
Donation Amount
A company may wish to track the amount of food it donates to food banks and other nonprofits. Records of these donations are usually kept and just need to be collated. If a company does not maintain records, food banks may record how much food they have received from each company.
Nutritional Content of FLW
The nutritional content of FLW can be assessed in several ways, including calories, macronutrients (i.e., carbohydrates, fat and protein), fiber and other micronutrients. The most comprehensive database of food types and their associated nutrients is USDA’s National Nutrient Database for Standard Reference, which contains information on 8,100 food items and 146 components, including vitamins, minerals, amino acids and more (USDA n.d.). By sorting FLW by food type and multiplying the amount of FLW by the nutrient of interest in the database, you can estimate the nutritional content of the FLW.
Meals Wasted
Expressing FLW in terms of meals wasted can show laypeople the impacts of FLW. Meals are generally expressed as a number of calories, usually 600–700.[1] To determine the number of meals wasted, first determine the total caloric content of the waste using the USDA National Nutrient Database for Standard Reference, then divide that number by the calories in a typical meal. This will provide a total number of meals, although it should be specified that these are not necessarily healthy or complete meals. Calories are just one measure of nutrition and depending on the type of FLW, meals may not be the best measure.
[1] There is no correct number of calories to consume per day (since proper intake depends on energy expenditure) but several health organizations suggest 2,000 calories per day for an adult as a reasonable average. Therefore, assuming three meals a day, the average meal would be 600–700 calories.
It is difficult to reduce FLW without understanding what causes it. For example, after performing a waste composition analysis, a restaurant may discover that it is discarding a large amount of tomatoes each week, but the waste data do not tell it why those tomatoes are being discarded. This module describes how to track causes of FLW when the information is not obvious in the quantification method.
Defining Causes and Drivers
There are two layers to identifying the cause of FLW – the immediate reason why something became FLW, and the underlying factor that led to the waste. The FLW Standard uses the terms “causes” and “drivers.” A cause is defined as the proximate or immediate reason for FLW, while a driver is defined as an underlying factor that played a role in creating that reason (FLW Protocol 2016a). Tables 4 and 5 list some possible causes and drivers by stage in the food supply chain.
Table 4. Some Causes of FLW by Stage of the Food Supply Chain
| Primary Production | Processing and Manufacturing | Distribution and Wholesale | Retail | Food Service/ Institutions | Household |
|---|---|---|---|---|---|
| Spillage
Cosmetic or physical damage Damage from pests or animals Not harvested Unable to sell due to quantity or size Unable to reach market |
Spillage
Trimming during processing Rejected from market |
Cosmetic or physical damage
Spoilage Past sell-by date Rejected from market Unable to reach market |
Product recall
Food prepared improperly Food cooked but not eaten Cosmetic damage Spoilage Past sell-by date |
Product recall
Food prepared improperly Food cooked but not eaten Cosmetic damage Spoilage |
Product recall
Food prepared improperly Food cooked but not eaten Cosmetic Spoilage Past sell-by or use-by date |
Source: FLW Protocol 2016a, CEC 2017.
Table 5. Some Drivers of FLW by Stage of the Food Supply Chain
| Primary Production | Processing and Manufacturing | Distribution and Wholesale | Retail | Food Service/ Institutions | Household |
|---|---|---|---|---|---|
| Premature or delayed harvesting
Poor harvesting technique/ inadequate equipment Lack of access to market or processing facilities Price volatility Overproduction Improper storage |
Outdated or inefficient equipment and processes
Stringent product specifications Human or mechanical error resulting in defects |
Excessive centralization of food distribution processes
Lack of effective cold-chain management Stringent product specifications Poor transportation infrastructure Failure in demand forecasting Ineffective packaging or storage conditions |
Regular replenishment of stocks to evoke abundance
Package sizes too large Failure in demand forecasting Too many products offered Lack of system for food donation |
Regular replenishment of buffet or cafeteria to evoke abundance
Portion sizes too large Failure in demand forecasting Too many products offered Lack of system for food donation Improper training of food preparers
|
Overpurchase
Inadequate planning before shopping Lack of cooking knowledge Confusion over date labels Inadequate or improper storage of food Desire for variety, resulting in uneaten leftovers |
Source: FAO 2014, FLW Protocol 2016a, CEC 2017.
If a restaurant discards a large amount of tomatoes, the immediate cause might be that the tomatoes spoiled after sitting unused in the kitchen. The underlying driver may be that the restaurant is incorrectly forecasting the amount of tomatoes it needs each week. Perhaps a previously popular dish that requires tomatoes is not selling as much as anticipated, but the restaurant is continuing to order tomatoes based on prior rather than current demand.
In this example, simply knowing that a large amount of tomatoes was being disposed of was not enough to determine the correct course of action to reduce waste. However, once the tomato FLW was linked to a cause (e.g., spoilage after not being used) and an underlying driver (e.g., failure of demand forecasting), the restaurant is now able to take action to reduce the FLW (e.g., reduce the weekly order for tomatoes or adjust the menu to remove the dish not being ordered).
In more complicated cases, the causes and drivers may not be clear. Meeting with an outside waste-reduction consultant may be beneficial. Numerous firms make detailed sustainability audits of facilities and organizations to address root causes of inefficiencies and unsustainable practices.
Incorporating Causes into FLW Quantification Methods
The methods described in this guide differ in how well they track the causes and drivers of FLW. Table 6 provides a list of methods, whether they can track causes and how to best do so.
Table 6. Tracking Causes by Method
| Method | Can it track causes? | How to track causes with the method |
|---|---|---|
| Direct weighing | Yes | Although direct weighing provides only numerical data, staff can be instructed to log causes while weighing the FLW. This will provide an additional data point about how the FLW occurred. |
| Waste composition analysis | No | A waste composition analysis will not directly provide information on causes of FLW, since the waste is being analyzed after it has been discarded. For this reason, waste composition analyses are often paired with a survey or process diary to generate qualitative data on causes and drivers assessed in tandem with the waste analysis. |
| Records | Not usually | Because records are kept for purposes other than FLW quantification, they are less likely to contain information relating to FLW causes and drivers. However, some records will have information that can help identify causes. (For example, a repair record for a piece of faulty equipment may help identify a cause of food waste.) Usually, a diary or survey will likely need to be implemented to generate qualitative data. |
| Diaries | Yes | A diary can be used to determine causes and drivers of FLW. The diarist can be asked to provide information on why the FLW occurred while recording it. |
| Interviews/Surveys | Yes | A survey can be used to determine causes and drivers of FLW. The respondent can be asked to provide information about why FLW occurs within their boundaries. |
| Proxy data/mass balance | No | Because inference by calculation is a mathematical operation based on material flows and proxy data, it will not provide information about causes and drivers of FLW. It provides only a quantitative estimate of the amount of FLW occurring within a given sector or commodity type. An additional analysis of the relevant sector or commodity will be necessary to understand the causes of FLW. |
Source: Authors.
How to Track Causes and Drivers
Causes and drivers can be tracked simply by capturing information on causes while numerical estimates of FLW are being logged. In most cases, only the immediate cause will be available at first and additional research may be needed to detect the driver. Table 7 shows an example of how causes and drivers can be tracked alongside numerical estimates of FLW.
Table 7. Tracking Causes and Drivers
| Food Type | Amount | Stage of the Supply Chain | Cause | Driver |
|---|---|---|---|---|
| Wheat | 1000 kg | Primary production | Eaten by pests | Improper storage on the farm |
| Apples | 10 kg | Processing | Trimmings | Inefficient equipment trims more than necessary |
| Strawberries | 40 kg | Distribution and wholesale | Spoilage / Damage during transport | Lack of effective cold-chain management / Improper packaging / Excessive centralization of distribution processes |
| Beef | 100 kg | Retail | Spoilage | Improper refrigeration |
| Fish | 34 kg | Food service/ institution | Spoilage | Failure in demand forecasting |
| Milk | 500 g | Household | Past sell-by date (but not spoiled) | Confusion over meaning of date labels |
Note: the information in this table is illustrative.
Source: Authors.
Once you’ve determined that it is worthwhile to measure FLW, define what FLW means in your operations and how you will communicate that information, both internally and externally. Reporting FLW data publicly has multiple benefits: it raises awareness of the issue, allows for information-sharing among businesses, provides information to policymakers and assists FLW tracking efforts over time.
Public reporting should align with the Food Loss and Waste Accounting and Reporting Standard, or FLW Standard. The FLW Standard is “a global standard that provides requirements and guidance for quantifying and reporting on the weight of food and/or associated inedible parts removed from the food supply chain” (FLW Protocol 2016a). The standard clarifies definitions and shows the possible destinations of FLW when it is removed from the human food supply chain.
Tracking Progress on Preventing FLW
The FLW Standard does not provide specific guidance on tracking progress on preventing FLW. However, prevention can be tracked by establishing a base year as a starting point and assessing prevention efforts against that baseline. If total production is increasing or decreasing, intensive measurements (tonnes per unit of production) can better quantify how much FLW was prevented. For example, a company may set a base year of 2016 when it had 15,000 tonnes of FLW. The following year, the FLW may be 13,500 tonnes, meaning 1,500 tonnes of FLW had been prevented.
A hypothetical example of how prevention can be tracked alongside FLW amounts is shown in Table 2.
Table 2. Tracking Reduction in FLW by Measuring FLW Sent to Various Destinations over Time (tonnes/year)
| 2016 | 2017 | 2018 | |
|---|---|---|---|
| Total Production | 100,000 tonnes | 100,000 tonnes | 100,000 tonnes |
| Anaerobic Digestion | 3,000 tonnes | 4,000 tonnes | 4,000 tonnes |
| Landfill | 8,000 tonnes | 6,000 tonnes | 5,500 tonnes |
| Sewer/water treatment | 4,000 tonnes | 3,500 tonnes | 3,500 tonnes |
| Total FLW | 15,000 tonnes | 13,500 tonnes | 13,000 tonnes |
| Tonnes FLW per unit of production (percent) | 15% | 13.5% | 13% |
| Reduction in FLW (percent relative to 2016) | 0% | -10% | -13% |
Source: Authors.
Reporting Amounts of FLW
Reporting using the FLW Standard requires setting the “scope” of your FLW, as shown in Figure 2. This scope includes only food that has been removed from the human food supply chain, meaning that food donated, redistributed or otherwise kept in the food supply chain is not included. Tracking redistribution of food may align with your objectives and can be tracked using a method similar to that outlined in the section “Tracking Progress on Preventing FLW.”
Figure 2. Scope of an FLW Inventory
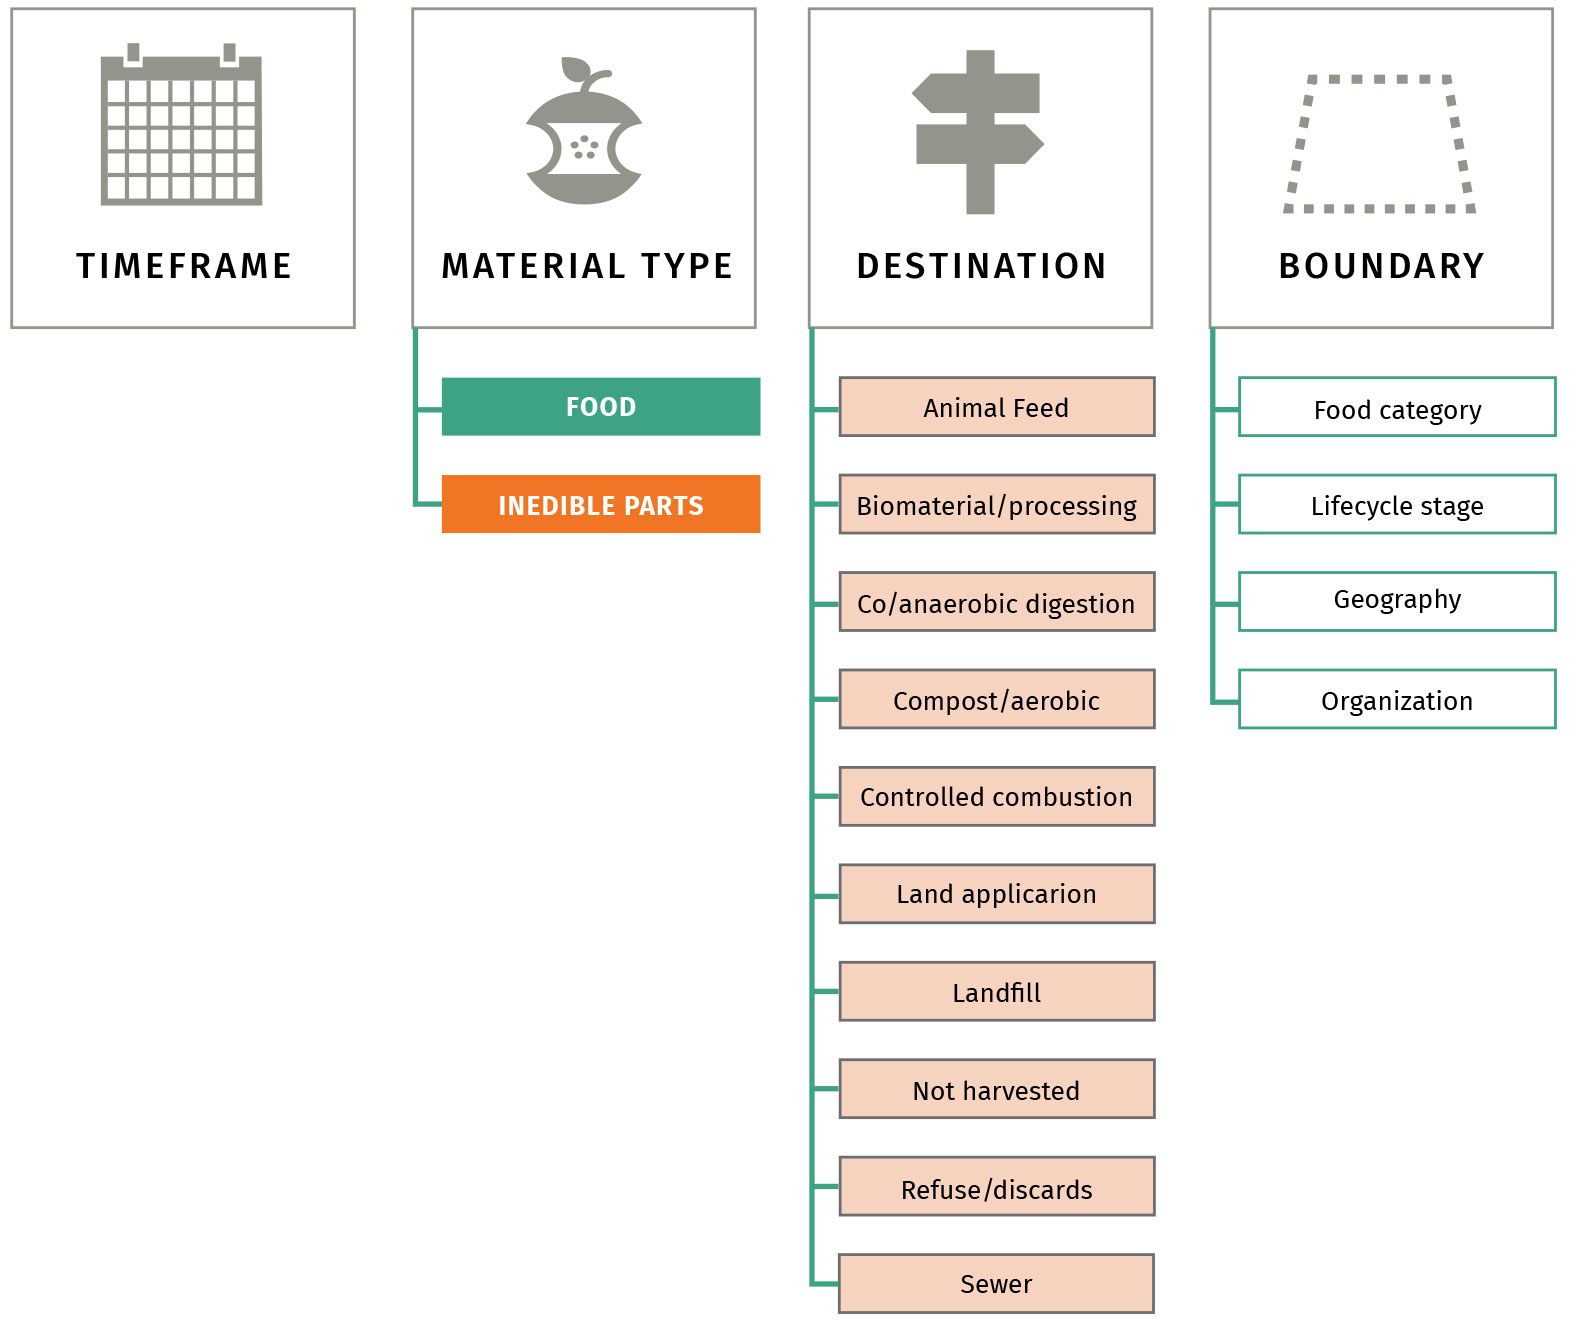
Source: FLW Protocol 2016a.
The scope has four components: timeframe, material type, destination and boundary.
Timeframe
Define the period of time for which the inventory results are reported. Typically, results are reported on an annual basis.
Material Type
Identify the materials included in the inventory: food only, associated inedible parts only, or both. Associated inedible parts are defined as the components of a food product that are not intended for consumption, such as bones, rinds or pits.
Destination
The destination is where the FLW goes when removed from the food supply chain. The 10 categories for destinations described in the FLW Standard are listed and defined in Table 3. Again, these destinations are only for FLW that has been removed from the human food supply chain and does not include prevention or redistribution of FLW, which can be tracked as described in the module “Tracking Progress on Preventing FLW.” Food that is distributed to humans outside the marketplace is not considered to be lost or wasted, since it is not sent to a destination.
Table 3. Definition of FLW Destinations used in the FLW Standard
| Destination | Definition |
| Animal feed | Diverting material from the food supply chain to animals |
| Bio-based materials/biochemical processing | Converting material into industrial products |
| Codigestion/anaerobic digestion | Breaking down material via bacteria in the absence of oxygen |
| Composting/aerobic processes | Breaking down material via bacteria in oxygen-rich environments |
| Controlled combustion | Sending material to a facility that is specifically designed for combustion in a controlled manner |
| Land application | Spreading, spraying, injecting or incorporating organic material onto or below the surface of the land to enhance soil quality |
| Landfill | Sending materials to an area of land or an excavated site specifically designed to receive wastes |
| Not harvested/ plowed-in | Leaving crops that were ready for harvest in the field or tilling them into the soil |
| Refuse/discards/litter | Abandoning material on land or disposing of it in the sea |
| Sewer/wastewater treatment | Sending material down the sewer, with or without prior treatment |
| Other | Sending material to a destination different from the ten listed above |
Source: FLW Protocol 2016a.
Food that is recovered for donation to feed hungry people, and that would otherwise be lost or wasted, is generally not considered to be FLW and therefore not identified as a destination in Figure 2. Some organizations may also exclude animal feed and bio-based materials/biochemical processing (where material is converted into industrial products) from their definition of FLW.
While definitions and scope of FLW can differ, it is nonetheless important to measure all possible end destinations of recovered food and FLW to support efforts to minimize operational inefficiencies.
Boundary
The boundary has four components:
- The food category, or the types of food included in the inventory;
- The lifecycle stage, or the stages of the food supply chain (e.g. processing and manufacturing, retail) included in the inventory;
- Geography, or the geographic borders within which the inventory occurs; and
- Organization, or the type of unit (e.g., household or factory) within which the FLW occurs.
Why Scope Matters
Disclosing the scope of an inventory is important because numerous definitions of “food loss and waste” exist. Some include only food but not inedible parts, while others consider only a subset of the possible destinations in the FLW Standard. By disclosing the scope of an inventory, a business or government clarifies its definition of FLW, thus allowingfor more accurate comparisons and tracking of FLW over time.
Additional Resources for Reporting
The FLW Standard contains a number of reporting resources. Chapter 6 outlines the process for setting a scope, and Chapter 13 provides additional guidance on reporting. A sample reporting template and customizable scope template are available for download.
Measuring and reducing food loss and waste is a big adjustment for many businesses, institutions and other organizations. Achieving significant reductions means challenging key assumptions about how a system operates. To accomplish significant change, you must prepare for it.
Within an organization, individuals will find many reasons to resist taking action on FLW. These concerns are often legitimate and should not be disregarded. However, they generally fall into broad categories.
“We don’t waste any food.”
FLW occurs whenever food that could have otherwise been sold and safely eaten is discarded. Opportunities to prevent and reduce FLW exist in all organizations and all stages of the food supply chain (i.e., from food production to consumption). Causes of FLW at different stages of the supply chain are highlighted in Table 4 of this guide.
While some organizations may focus on directing wasted food to beneficial end uses, such as animal feed, bioproducts and composting, they can profit more by taking steps to minimize the amount of FLW generated in the first place.
Simply put, FLW represents an operational inefficiency to an organization—the costs of which compound over time. Minimizing the amount of FLW generated from the outset (i.e. before it needs to be managed as waste) is good for the long-term financial health of an organization. Measurement helps to identify where those money saving opportunities exist, by pinpointing where ongoing FLW is generated within a facility.
“We already have too much going on to measure something else.”
Many sustainability managers are already tasked with overseeing various measurements, such as greenhouse gas (GHG) emissions or water use. Measurement of FLW can seem like an added burden. However, FLW represents an operational inefficiency that not only costs a business directly but also relates to many other environmental impacts, including land, water, and greenhouse gases. Profit margins for food businesses are often slim and addressing inefficiencies can cause significant benefits for a company’s bottom line. So although FLW may seem like “just another thing to measure,” it in fact can lead to significant benefits for the business.
Initial measurements may be aided by existing records to provide a cost-effective start. Inventory records and waste transfer receipts can provide an early estimate of FLW levels with minimal investment. These records can help to ease whatever time burden that FLW measurement may represent for a company or organization. The “Records” section in Appendix A provides more information about using such documents to estimate FLW levels.
“It’s not worth the cost to measure FLW.”
The cost of measuring and implementing changes to prevent and reduce FLW is small relative to the long-term economic upside. Measuring FLW helps to identify where operational and process inefficiencies may exist, and also helps to signal where corrective action is needed. Many approaches to measuring FLW can be achieved with minimal investment, while others may require higher levels of investment. The “Sector-Specific Guidance” module in this guide offers tables displaying a range of methods for measuring FLW along with the level of resources required.
The upfront costs associated with FLW measurement, prevention and reduction are frequently paid back within a relatively short time period, often within a period of less than one year. The module “The Business Case for FLW Measurement, Prevention and Reduction” provides more information about payback periods for investments.
“This is the way we’ve always done things.”
Generating FLW is often built into the assumptions of how a business or organization operates. For example, in a restaurant that operates a buffet, a certain amount of leftover food may be expected as “the cost of doing business.” However, measuring those leftovers might pinpoint opportunities to prevent and reduce FLW and save money (e.g. using smaller plate sizes, discontinuing unpopular dishes).
Different parts of a business or organization will also have different perspectives on FLW. A chef in a restaurant may think of “food waste” as food that gets thrown away from the refrigerators, but not consider waste from food preparation or plate waste. A server in that same restaurant may not think about food that’s getting thrown away from refrigerators, but may be very aware of the food that customers leave on their plates. By ensuring that everyone is using the same definition and considering all potential sources, you may be able to overcome some resistance to FLW measurement and reduction. The “Setting Your Scope” module of this guide can help you establish a common definition.
“This isn’t working.”
If a change is not going smoothly it is important to understand why this is the case. Each of the following elements can greatly improve the likelihood of success:
- senior management commitment and support
- sufficient resources (funding, time, expertise)
- concrete plan that allocates responsibilities
- employee awareness and training
- internal “champions” to foster action
In one case, the Provision Coalition worked with Ippolito Fruit & Produce in Canada to prevent and reduce FLW in its operations. For the “reinforcement” stage in the change management process, they identified key steps to help keep the change in motion (Mereweather 2018):
- Gathering feedback from employees
- Developing accountability and performance management systems
- Auditing and identifying compliance with the change
- Finding root causes of FLW and taking corrective action
- Recognizing, celebrating and rewarding successes
These steps can help keep people on board with the difficult process of making a change toward FLW measurement, prevention and reduction. Like any new change, there will be challenges along the way. But if a business has a strong case and rationale, these challenges can be overcome.