Land Cover Change 30m, 2010-2015 (Landsat)
Map type: Terrestrial Ecosystems
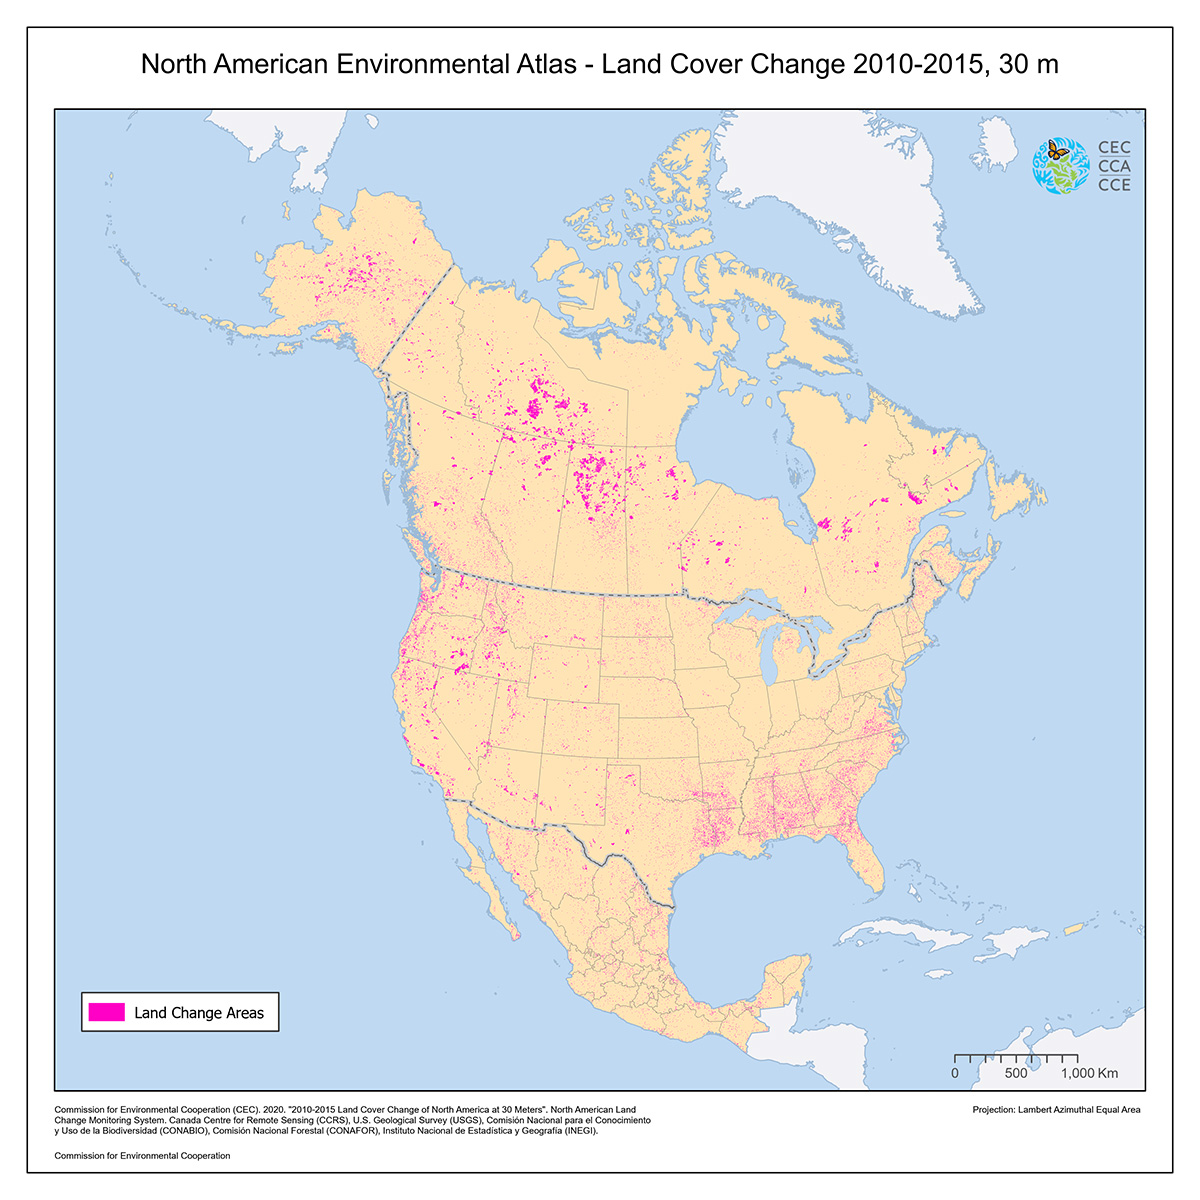
This map demonstrates land cover change between 2010 and 2015 in North America at a spatial resolution of 30 meters.
The dataset shows the 2010-2015 changes between the nineteen Level II land cover classes, which were defined using the Land Cover Classification System (LCCS) standard developed by the Food and Agriculture Organization (FAO) of United Nations. A dataset on general losses and gains is also provided for users that are interested in viewing landscape changes to forest, shrubland, grassland, wetland, cropland, barren lands, urban, water, and snow and ice. Data showing the 2010-2015 changes between the twelve Level 1 land cover classes are also available upon request.
The land cover change data is part of a series of maps produced by the North American Land Change Monitoring System (NALCMS). NALCMS is a collaborative initiative between Canada, Mexico, and the United States to monitor land cover and its change over time. The NALCMS product displayed in this map represents land cover change based on monthly composites of 2010 and 2015 Landsat satellite imagery.
The North American Land Change Monitoring System (NALCMS) is a joint initiative between Natural Resources Canada (NRCan)’s Canada Centre for Mapping and Earth Observation (CCMEO), the United States Geological Survey (USGS), and three Mexican organizations: the National Institute of Statistics and Geography (Instituto Nacional de Estadística y Geografía—INEGI), the National Commission for the Knowledge and Use of Biodiversity (Comisión Nacional para el Conocimiento y Uso de la Biodiversidad—Conabio), and the National Forestry Commission (Comisión Nacional Forestal—Conafor), and supported by the Commission for Environmental Cooperation (CEC).
Disclaimer: Mexico land cover maps of 2010 and 2015 were produced based on different satellite imagery sources and methodologies. Mexico’s land cover classification in 2015 is presented as an improvement of the previous 2010 map, therefore it represents a new base line map for Mexico that shall not be compared with the previous map to assess change detection. Change polygons over Mexico were assessed based on an independent change detection algorithm and land change values were extracted using those polygons. Land changes cannot be derived based on the subtraction of values from the 2010 and 2015 maps.
Partner Organisations